U.S. milk production is hitting new record highs. In March 2021, 19.8 billion pounds of milk were produced, a two percent increase over the prior year. In the first quarter of 2021, the twelve-month moving average of milk production (Chart I) grew by two percent over the prior year. After adjusting for leap year in 2020, the quarterly growth rate was also up two percent over the prior year. By every calculation, milk production is growing by two percent annually.
 |
| Chart I - 12 Month Moving Average of U.S. Milk Production |
The number of dairy cows has hit a new record high of 9,468,000 cows (Chart II). The increase in number of cows was just under one percent vs. the prior year.
 |
| Chart II - Number of Dairy Cows in the U.S. |
Milk per cow has also continued to increase just over one percent vs. the prior year (Chart III). This is consistent with prior years. The increases of more cows and more productive cows combine to make up the two percent increase in milk production.
 |
| Chart III - 12 Month Moving Average of Milk per cow per day |
All classes of milk are paid for butterfat based specifically on the butterfat content. More butterfat equals more revenue for all producers.
As shown in Chart IV, butterfat percent in milk is growing, through breeding, genetics, nutrition, and management. In the first quarter of 2021, butterfat in milk averaged over four percent for a record quarter. The growth of butterfat in milk is just shy of two percent over the prior year. With more milk being produced and higher butterfat content in that milk, total butterfat production is growing at a rate of nearly four percent annually. This is nearly twice the growth rate of domestic butter consumption.
In the prior post, the significant growth of butter inventories was shown. With the increase in inventories, butter prices have tumbled (Chart IV). Slowing the growth of butterfat would be difficult as this is a good revenue stream for all milk producers. Butter exports will likely increase to absorb this excess butterfat.
 |
| Chart IV - Butterfat Price and Percent of Milk |
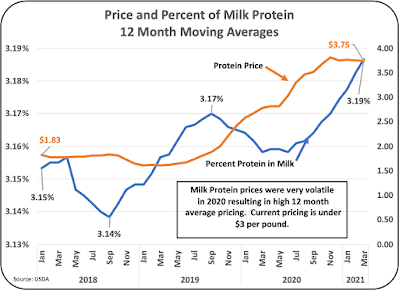
Class III milk for cheese makes up over 50 percent of total milk usage. Milk protein is very important for efficient cheese production and financial incentives are common for higher milk protein levels in Class III milk. However, milk protein is not specifically paid for Class I and Class IV milk. Increasing milk protein typically requires improved nutrition which does typically carry an increase in feed costs. Therefore, increases of milk protein are not as consistent as butterfat growth. The growth of milk protein is also dependent on the price of milk protein as shown in Chart V. During 2021, milk protein as a percent of milk is growing by over one percent annually. Milk protein in milk has averaged 3.25 percent in 2021 with higher milk protein prices.
With the growth in milk at two percent and a one percent increase in milk protein percent in milk, the volume of milk protein in the U.S. is growing by about three percent annually. In areas like the Upper Midwest where nearly 90 percent of the milk goes to cheese, the increases in milk protein are much higher. For the first quarter of 2021, milk protein percent in milk in the Upper Midwest grew by 7 percent over the prior year.
 |
| Chart V - Milk Protein Price and Percent of Milk |
WHAT DOES ALL THIS MEAN?
The chain of events leading to producer milk and component payment begins with milk and component production. Increases above consumption will increase cheese and butter inventories. In turn the increased inventory levels will decrease cheese and butter prices. By the formulas, lower cheese and butter prices will decrease milk protein and butterfat values.
Considering the analytics in this post and the prior post, the pricing of butterfat and milk protein will likely remain stable in the near future.
- Butterfat stocks are high, and production of butterfat is robust. There is increasing amounts of milk available, and that milk has more butterfat than previously. Therefore, butterfat prices will remain low. More exports of butter, especially to Canada, are likely.
- Cheese prices are remaining relatively high with April at $1.71 per pound. By the component pricing formulas, high cheese prices and low butter prices combine to make milk protein pricing higher. As covered in the prior post, cheese inventories are steady. However, there is some caution on cheese pricing as producer milk (growing at two percent annually) will supply more milk than needed domestically. Historically, any excess will be converted to cheese as it can be stored for longer periods. This would bring bloated inventories and lower prices. This could occur in the second half of 2021.
- Table I displays the three year history of cheese and butter pricing. The current prices are in line with historical averages. The futures markets are showing a small (approximately six percent) increase in butter pricing later in 2021. Cheese futures are showing slightly larger price increases (approximately eleven percent) later in 2021. Based on the currently available data, these increases are unlikely.
 |
| Table I - Cheese and Butter Pricing Producer emphasis on butterfat and milk protein components remains the most important parameter to maximize revenue and cash flow on dairy farms. |


No comments:
Post a Comment