Sunday, August 21, 2016

Butter

This post will be primarily about butter.  Butter prices in the U.S. are running much higher than the international butter prices.  While butter prices do not have a significant influence on the Class III price (more on this below), they do influence the component prices.  When butter prices are high, butterfat prices are high, and with everything else remaining the same, milk protein prices are lower.  The two component prices largely offset each other with only small changes in the Class III price.

In July, butter prices were $2.32/lb. making butterfat worth $2.60/lb. The breakdown of the milk check was shown as coming 60% from butterfat and 37% from milk protein.  However, if butter was at its longer term pricing of $1.50/lb., butterfat would be worth only $1.61/lb.  With that change, milk protein would then be worth $2.95/lb. instead of the July price of $1.91/lb.   The impact the Class III price would only change by $.40/cwt., but butterfat would contribute only 38% and milk protein would contribute 59%.  The pie chart of component revenue would change drastically as shown below.  (See these two prior posts for more detail on the analytical relationship between butterfat and milk protein pricing - August 7, 2016 and April 23, 2009.)


The current high butter prices have interrupted the long-term trends in the value of milk protein and butterfat.  Butterfat is currently valued higher than milk protein.  This has created a different point-of-view for dairy producers who now see milk fat as the primary revenue source.  This runs contrary to the long-term diet trends which include more consumption of cheese (which requires higher protein levels) and lower consumption of high calorie fats.


Butter prices have remained above $2/lb. since 2013.  This price is well above historic prices and well above international prices.  At a time when milk prices are at extreme lows, how is possible that butter prices are at highs?


What are the factors keeping butter prices so high?  There are at least three factors keeping butter inventories in check and prices high.  They are 1) an increase in per capita consumption of butter, 2) reduced churning in the U.S., and 3) trade restraints on imports of butter.

Dating back to 1930, per capita consumption of butter was very high.  However, during WW II, as alternate products were developed to compensate for the cost and availability of real butter, per capita consumption dropped dramatically.  Over time, these butter "alternatives" improved and gained favor.  Most of the alternatives were vegetable oil based and, included partially hydrogenated oils that were hydrogenated to attain a specific melting point.  However, because partially hydrogenated oils contain trans fats, which are bad for heart health, vegetable oil spreads were changed to oil blends to achieve a specific melting point.  During this change, butter gained favor based on concerns about partially hydrogenated oils and has since increased per capita consumption.


Churning of U.S. butter has remained stable.  Because the U.S. population is up and individual consumption is up, there is not sufficient domestic butter available.  Currently no capacity is being added.


The chart below compares European, Oceania, and U.S. wholesale butter prices.  Obviously, for over a year, the U.S. price of butter has been well above the price of other major exporters in Oceania and Europe.


During this time imports have increased to 4 times the early 2014 level.


With the huge difference in the U.S. butter prices vs.international prices, the logical question is why has more butter not been imported.  More imports would cause U.S. butter prices to more closely equalize with international prices.   Supply changes certainly take time, but the change in imports happened quickly and has now leveled off.

A look at the sources can help explain this.  We do have a free trade agreement with Mexico, which allows Mexico to ship butter (or the more concentrated form known as anhydrous milkfat) as long as its origin is Mexican.  They cannot import butter and then ship it to the U.S.  However, they can use imported butter for their domestic needs and ship more Mexican butter to the U.S.  Mexico is our largest source of butter and for the first half of 2016, imports are up nearly 75%.


The other roadblock to additional imports is the two tiered tariff rate quota.  Other countries that the U.S. has tariff rate quotas with can attain a license to export to the U.S. with minimal tariffs up to a certain level.  Beyond that level, the tariffs are much steeper and in most case prohibitive.  Over time, and with additional free trade agreements, the tariff and quota agreements will probably be lessened to allow more open markets.

The more immediate question is how long can the U.S. maintain the current price spread over other international suppliers.  European butter is showing increases in pricing, but butter from Oceania is still well under $1.50/lb.   In an age where free trade agreements are gaining favor, prices over time will come closer to equalizing.   There is little doubt that this will happen, but the time schedule can vary with the politics of free trade and difficult negotiations with potential sources.  The futures market is pricing these changes with butter prices falling to the low $2/lb. price range in 2017 and $1.80/lb. in 2018.

From a producer's point-of-view, while revenue today is primarily from butterfat, it is likely that this will change, and a producer should have plans to survive in a changing market which pays higher prices for milk protein and lower prices for butterfat.   

Sunday, August 14, 2016

Dairy Exports and Imports Show No Change in Trends

In the prior post, the current domestic status of dairy pricing was reviewed.  These domestic analytics did not show any major change from prior months except for July's higher prices.  In this post, international analytics are examined.  To date, the export, import, and exchanges rates that influence U.S. dairy pricing are also not showing any significant trend changes.  Exports and imports remain close to prior months and the USD continues to be very strong against currencies of other dairy exporting countries.

The charts below present a comparison to the prior month.  Where exports are up, so are imports.  Where exports are down, so are imports.  As will be shown in this post, there are only minor changes in net exports (exports minus imports).


As the dairy industry continues to change from a national market to an international market, competition from around the globe continues to dominate domestic pricing.  The four dairy commodities used in U.S. producer pricing formulas, cheese, butter, nonfat dry milk, and dry whey, are all showing no major shift in U.S. export/imports.

CHEESE

Cheese pricing is by far the most important variable in producer pricing.  (See the earlier post to the blog for a detailed explanation.)

Cheese net exports remain at a five-year low for the month of June, and for the entire first half of 2016.  They continue to run at a rate just one-third of the 2014 pace.


Cheese exports continue at the same sluggish pace compared to prior years.   However, imports are well above prior years.  Imports rose steadily in 2015 and are currently staying at these elevated levels in 2016.  Cheese imports are running at about 60% of export levels.  Many press comments focus on only exports, but imports impact cheese inventory levels too, and thereby, impact domestic cheese wholesale prices.


Cheese exports primarily are going to Mexico, but imports are coming from a variety of sources.  The major increases in 2016 are from New Zealand and Lithuania.  Italy and France remain significant import sources. 


BUTTER

Butter net exports fell to a new low.  Butter prices from Europe are currently around $1.56/lb., with Oceania (dominated by New Zealand and Australia) around $1.27/lb.  By comparison, the U.S. NASS price for July was $2.32/lb.  With these statistics, it is amazing that U.S. butter has continued it's high NASS price.  Domestic buyers are increasingly using alternate international sources.  A price leveling between domestic and international sources is inevitable.


Increased butter imports are coming in from Mexico, Europe, and Oceania.  Mexico remains the largest source.  With NAFTA rules, Mexico cannot import butter from other countries and then export it to the U.S., but they can use imported butter for Mexican consumption while exporting locally produced butter to the U.S.


NONFAT DRY MILK

The story continues much the same for nonfat dry milk.  Imports continue at record levels and exports remain well below the prior three years.  Prices are slightly higher globally and the U.S. prices are also up slightly.  However, there has been no significant increase in exports and imports are at record highs.


DRY WHEY

Dry Whey exports did improve slightly in June, but they are still at five year lows.  The trend is up, and this analytic will continue to be followed in future posts.


The only item up significantly in exports is whey protein concentrates that are going primarily to Canada.  Under NAFTA rules, high protein dairy products are the only dairy products that can be exported to Canada.

EXCHANGE RATES

Exchange rates continue to reflect the strength of the USD.  Below are the exchange rates with the most impact on dairy exports and imports.  The strength of the USD vs. the Euro continues to give European dairy products an advantage in the international markets.  The New Zealand dollar has shown some increasing strength in 2016, but it is still well below 2012 to 2014 levels.  The Mexican peso continues to weaken, making U.S. exports to Mexico more expensive and imports from Mexico less expensive.


SUMMARY

As mentioned in the prior posts, current and future U.S. dairy prices are showing some improvement.  Although the low international prices and oversupply are crippling some international producers, which could reduce global supply, to date, there are no firm indicators that would suggest increases in U.S. dairy prices.  Hopefully some supporting analytics will be appearing soon.  They will be followed closely in future posts to this blog.


Sunday, August 7, 2016

Every Price is UP! - Turning Point?

On August 3, Class and Component prices for July were released.  The change from June was a complete sweep of higher prices.  The Class III price Jumped by $2.02/cwt. to $15.24/cwt. The hard question is whether this is a temporary spike or is it a long-term trend.

All Class III futures prices are above July's prices, ranging in the $16 and $17/cwt. range. Milk priced at $16 to $17/cwt. is not near highs, but is certainly better than the $13 to $15/cwt. range which has existed for most of 2015/16.


The biggest mover was the price of milk protein, up 29.1%.  This is a huge increase.  What is causing such a huge increase?  Milk protein increased from $1.48/lb. to $1.91/lb.  The $.43 change is big, but the percentage increase reflects how low the June price of milk protein was at $1.48/lb.  The June price was one of the lowest prices for milk protein in 15 years (see chart below).  The percentage increase of 29.1% reflects the very low base of the June price.


The price of milk protein is formula dependent on the price of cheese and butter.  A higher price for butter reduces the price of milk protein while a higher price for cheese increases the price of milk protein.  The logic of this formula is that butterfat carries a different value when used in cheese vs. butter.  If the butterfat is more valuable in butter than cheese, it carries a negative value for milk protein.  Recently, butter has been near record price levels.  The chart below shows the split of butter and cheese pricing on the milk protein pricing.


In July, butter prices were up, but cheese prices were up more, and therefore the relationship of these prices helped create the 29.1% increase in the value of milk protein.

However,  the price of Class III milk is still primarily dependent on the butterfat production.  As shown in the pie chart below, payment for butterfat is responsible for 60% of the Class III milk price.


The July increases are very positive.  The futures prices indicate that many buyers and speculators see this as a lasting higher value.  Some of this speculation is based on reduced global production of milk that will improve international prices and thereby improve domestic U.S. milk prices.

The remainder of this post will review the status of domestic inventories that heavily influence domestic milk and component prices, to see if these fundamentals support the July price increases.   Production feeds these inventories and will therefore also be reviewed.

The influence of exports, imports, exchange rates and international dairy commodity prices will be reviewed in the next post to this blog.

Cheese prices and the Class III milk price are tightly correlated as shown in the chart below.  This tight correlation is a result of the formulas used by the Federal Milk Marketing Orders.


CHEESE

Because cheese prices are so fundamental to milk pricing, the first commodity to be reviewed will be domestic cheese inventory and production.  In summary, inventories are still high and production of new cheese remains robust.


Cheese inventories remain close to 10% above the levels of 2013 and 2015.  They are also nearly 20% higher than cheese inventories of 2014, when cheese prices and Class III milk prices were near record levels.  This would indicate that the current price increases for cheese do not reflect the persistently high inventory levels.

Production of cheese also remains robust compared to prior years with June production of cheese continuing at the year end levels of 2015 and YTD 2016.   This production level would indicate that cheese inventories will probably not decline in the near future.


There are three other dairy commodities that are used to price producer milk.  They are butter, nonfat dry milk, and dry whey.

BUTTER

The inventories of butter have not changed in the June ending inventories.  Nevertheless, butter prices increased by 7.1%, which has to be based on something other than inventory levels.  


Butter production has also remained at levels slightly above prior years, so this would indicate continuing high butter inventory levels.  International prices for butter remain well below U.S. domestic butter prices.  


Wholesale butter prices are used to set the value of butterfat.

 NONFAT DRY MILK

Nonfat dry milk is largely an export item and domestic prices reflect the competitive international prices.  Inventories for 2016 remain at constant levels, but pricing is largely dependent on international prices.


The international price may justify the 6% increase in July's NASS pricing.  International prices will be covered in the next post to this blog.

Nonfat dry milk is the basis for pricing Class II and Class IV milk and may be used for Class I pricing.

DRY WHEY

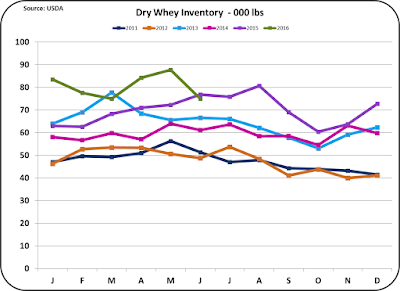
Dry whey is the final commodity to be reviewed.  Dry whey inventories do not fluctuate as much as some other dairy commodities, because whey is dried to fulfill standard inventory levels.  Wet whey is sold for other uses at lower prices.  Dry whey is also a major export item.


Nothing in the dry whey inventories substantiates the 5.4% increase in July prices.  However, international prices play a large part in pricing dry whey.  Dry whey pricing is used to set the price of "other solids" in the Federal Order component system.

In summary, the price increases seen in July for all dairy products, are not substantiated by the current domestic inventory data available.  In the next post, new international data will be reviewed to see if this data supports the July increases.