Sunday, December 11, 2022

Have Butter Prices Started Their Decline? Maybe Not

The newly announced Agricultural Marketing Service (AMS) prices for milk and components showed a decline in butter and butterfat prices.  Butterfat prices are primarily responsible for the 2022 high prices for producer milk.  In the October 2022 post to this blog, the fall of butter prices was expected in early 2023.  Has the decline already started?  This post will review the fundamentals behind butter and butterfat pricing to see if the decline has really started.

In October 2022, butter prices hit another record of $3.19 per pound.  In November, the price fell to $2.96 per pound.  The increase began in 2021 when butter prices were $1.36 per pound and steadily increased to the record October level (Chart I).  The weekly pricing levels reported by AMS show butter pricing increasing over the last four weeks.  The weekly pricing reports are consolidated at the end of the month and become the AMS price for that month.

Chart I - AMS Butter Price

The price of butterfat is mathematically linked to the price of butter.  The AMS price of butter is inversely correlated to the wholesale inventory levels of butter.  When there is a lot of inventory, prices are low.  When inventories are low, prices are high (Chart II).  

Chart II Butter Inventory and Price

So where do the butter inventories stand?  Chart III shows the cold storage inventory levels of U.S. butter.  In October, the most recent data available, inventories have continued their declines as shown by the red line in this chart. October 2022 inventory levels are 20 percent below the October 2020 levels.

Chart III - Butter Cold Storage Inventories

Inventory levels are primarily dependent on butter production matching domestic consumption.  Consumption has been growing, but production has been declining.  Chart IV is a six-year chart of butter production.  Butter production is cyclical and has been declining for two years.  For the month of October 2022, the monthly U.S. butter production was at the same level as the prior three years, about 161million pounds.  For most other months, production has been declining.

Chart IV - Production of Butter

California is by far the largest U.S. butter producer.  Over five years California has increased their U.S. market share of butter production from 29 percent to 34 percent.  

Chart V - California Market Share of Butter Production 

In September and October of 2021 and 2022 the California production levels of butter were almost even, indicating no year-over-year increase in production but also no declines (Chart VI).  

Chart VI - California Butter Production

Butter production in the rest of the U.S. shows a steady October volume for the last four years, but the overall decline is obvious (Chart VII). 

Chart VII - U.S. Butter Production Excluding California

The losses in U.S. butter production are coming primarily from states other than California and it is widespread.  That indicates that to recover inventory levels, U.S. butter production increases must occur in many locations in the U.S.  This will not happen quickly.

Domestic per capita consumption of butter has been on a steady rise for a long-time (Chart VIII).  Will the consumption levels continue to increase with higher prices?  There are two different thoughts on how this might play out.

  1. One scenario is that butter is a very small part of the food budget.  Perhaps consumers will continue to buy butter and accept the higher cost.
  2. The other scenario is that consumers will look for cost reduction in all grocery items including butter if they are struggling with inflated prices.
It is likely that there will be a blend of both scenarios resulting in only a small decrease in the growth of butter per capita consumption.

Chart VIII - Per Capita Consumption of Butter

Putting the puzzle pieces together, what is the mostly likely outcome?  It appears that even though AMS butter prices fell in November they may not fall again in the short-term.  Production issues have not been resolved enough to rebuild inventories.  The low butter inventories will take longer to recover and butter prices will continue to remain high in the near future.

This will be the last post to this blog in 2022.  Enjoy the holiday season and celebrate the new year that will hopefully bring cheer and prosperity to all.  New posts will be made in early 2023.


Sunday, December 4, 2022

Dairy Inflation

The U.S. is suffering from extreme inflation.  Are dairy products contributing to the inflation?  If so, what products are contributing to inflation?  This post will examine how dairy retail prices have escalated and how that compares to overall U.S. inflation.  Most of the data in this post is based on the Consumer Price Index (CPI) and data from the Bureau of Labor Statistics (BLS).  It will also review the inflation in the Agricultural Marketing Service (AMS) prices for milk and milk components.

Chart I below shows the annual inflation rate for the Consumer Price Index.  The blue line is the increase of overall CPI, and the orange line is the increase of the Food CPI.  Annual inflation started growing in 2021 and accelerated to high levels in 2022.  Prior to that time, inflation was near to the target rate of two percent annually.  The overall CPI hit a high of 9.1 percent in June 2022.  The Food CPI climbed higher than the overall CPI reaching 11.4 percent in August 2022.  Since then, there have been some declines in the rate of inflation, but the inflation rates are still well above the two percent goal. 

Chart I - Consumer Price Index

U.S. dairy retail product price increases will be compared below to the CPI Food index.  The charts below are listed in the order of their increases from largest to smallest.  As prices increase, there is often price elasticity of demand, meaning that as the price increases, less will be purchased. Some dairy products like fluid milk are usually considered to have a very small price elasticity of demand as they are a must buy in most households.  Other dairy products are more likely to experience lower sales with higher prices.

Butter has seen the largest retail price increases (Chart II).  There are multiple reasons for this, but the fact remains that the retail price of butter has escalated tremendously reaching a 33 percent annual increase as of October 2022.  

Chart II - Butter price increases vs. Food CPI

Butter production is still below historical levels and inventories are continuing to decline. Butter sales have been increasing in recent years, but with the high prices there could be a decline in sales.  In the case of butter, there are alternative plant-based margarine products that have stood the test of time and are readily available in significant quantities.  Price elasticity of demand may come into play with butter.  As of October 2022, retail butter prices continue to increase.

Some of the issues that impact wholesale butter prices include production levels and wholesale inventory levels.  These variables have been covered in prior posts to this blog:  

May 7 - Butter, Butter, Butter

July 5 - Butter Up, Cheese Down

September 11 - Butter Production is a Problem!

November 6 - Are Producers Taking Advantage of High Butterfat Prices?

Fluid milk is the second in terms of the highest inflation increases.  The annual increase in fluid milk retail prices reached 20 percent in May 2022, double the CPI food price index in the same month. However, retail price increases for fluid milk are beginning to slow and are at 14 percent year over year in October 2022. This is still way above the two percent guideline.  Fluid Milk is a commodity and competition should keep prices in line (more on this below).

Chart III - Retail Price Increases of Whole Milk vs. Food CPI 

Cheese retail price increases are more in line with the Food CPI (Charts IV and V).  Cheddar cheese is a very important cheese to follow as the wholesale price of Cheddar is used to represent the overall price of cheese in the Federal Order formulas.  Production of Cheddar cheese and inventories of American cheese (primarily cheddar cheese) are at reasonable levels to support normal supply and demand.  In 2020 there were issues caused by the "stay at home" COVID polices that switched demand to and from retail groceries and food service.  Some of the 2022 annual increases are the result of the low 2021 Cheddar cheese prices.

Chart IV - Retail Price Increases of Cheddar Cheese vs. Food CPI

Retail price increases for processed cheese (Chart V) follow the same pattern as Cheddar cheese.  However, current price increases are somewhat greater than for Cheddar cheese.  

Chart V - Retail Price Increases of Processed Cheese vs. Food CPI

To answer the question in the introduction, "Are dairy products contributing to the inflation?" Charts II through V above all show retail dairy price increases at or above the Food CPI which is above the overall CPI increases.  Yes, dairy products are contributing to inflation.

Are the AMS dairy prices used to price producer milk also showing inflation?  The price percent increases in AMS data has risen faster than CPI figures for dairy products.  The higher prices paid for raw milk have helped cover the increases in feed and labor costs that are being experienced "on the farm."  

Butterfat, the biggest price bubble in dairy, has seen huge price increases in 2021 and 2022.  Month by month, the increases over the prior year have reached to record levels, more than doubling butterfat prices from two years earlier.  In January 2022, butterfat prices were 92 percent higher than the prior year.  The year-to-year increase has slowed down to 42 percent as of October 2022, which is still far above all other inflation numbers in this post. 

Chart VI - Percent Annual Increase in AMS price of Butterfat

Fluid milk retail prices have increased by a high of 20 percent in May 2022.  During that same month, the base Class I price for milk was up 53 percent.  The Federal Order formulas for Class I pricing are linked to butter, cheese, and nonfat dry milk prices, not retail milk prices.

Chart VII - Percent Annual Increase in AMS price of Class I Milk

Cheddar and processed cheese retail prices increased by a max of 13 and 16 percent (Charts IV and V).  Producer prices for Class III milk for cheese hit a much bigger increase of 48 percent (Chart VIII).   

Chart VIII - Percent Annual Increase in AMS price of Class III Milk

Yes, the producer price for raw milk is increasing significantly.

SUMMARY

The retail price of dairy products has increased by more than the food CPI which is higher than the overall CPI.  Dairy retail prices are adding to the overall food CPI increases.  The rate of retail price increases in dairy products is contributing to the extreme U.S. inflation currently taking place.

Producer revenue percent increases are also well above the retail price increases.


Sunday, November 27, 2022

Is Plant-Based "Milk" Cannibalizing Dairy Milk?

Plant-based "milk" sales are growing.  Plant-based milk typically has shelf space beside the dairy milk in the refrigerated section of stores and the space rivals the space for dairy milk.  While dairy milk continues to decline, plant-based milk is growing.  Is the growth of plant-based milk cannibalizing the dairy market for milk?  If so, how much is it cannibalizing?

This post will cover the facts in the growth of plant-based milk and where it may be heading in its competition with dairy milk sales.  It will also cover the impact of plant-based milk sales on butter production.

Much of the published literature uses dollar value as the common denominator in comparing dairy and plant-based milk sales and gives plant-based milk a 16 percent market share.  This published data is based on dairy and plant-based milk sales at 2021 prices.   With inflation and competition. those numbers have changed significantly.  Plant-based milk is still more expensive than dairy milk, but the pricing difference has narrowed.  Consumers do not drink dollar values. That is why the data used in this blog post is based on sales volume in pounds, not dollars.

Charts I and II below are stacked graphs with the dairy milk on the bottom and the plant-based milk on the top.  Both charts plot sales in billions of pounds.  Chart I covers the actual data from 2013 to 2021.  In 2013, plant-based milk had just two percent of the total volume of dairy and plant-based sales.  With a decline in dairy milk and growth in plant-based milk, by 2021 plant-based sales had doubled to 4.1 percent of the total.

Chart I - Sales of dairy and plant-based milk products.

Statista made projections of the increase in plant-based milk through 2026.  Chart II covers the period through 2026 with the Statista projections for plant-based milk and a continuing decline in dairy milk sales of two percent annually.  With these assumptions, plant-based milk will make up 5.8 percent of total milk in 2026.

Chart II - Sales of dairy and plant-based milk
with projections through 2026

In terms of plant-based products, almond milk is the clear leader with a 58 percent market share.  Commercial growth of almonds is exclusively in California.  The almonds or the almond milk must travel a considerable distance to blanket the U.S.  Oat milk is second with a 17 percent market share.  In 2022, almond milk lost some market share and oat milk gained market share.  Together almond and oat milk make up 75 percent of plant-based sales.  

Why do people spend more for plant-based milk?  Why do they switch from dairy milk?  Why do the majority stick with dairy milk?  What are the key factors in deciding between dairy and plant-based milk?

There are quite a few elements that entice milk buyers to buy plant-based milk or stick with dairy milk.  

  • One factor is lactose intolerance.  There is lactose treated dairy milk that contains the enzyme that can break down lactose for digestion.  It is primarily available in whole milk and two percent fat milk.  There is no lactose in any plant-based milk.
  • Dairy milk does contain cholesterol.   Plant-based products do not contain cholesterol.  
  • Shelf life is another factor that favors plant-based products.  They are typically labeled with an expiration date that is longer than dairy milk.  Part of that is the limited fat or no fat in most plant-based milks. Dairy milk can develop off tastes more quickly.
  • Plant-based milk is higher priced than dairy milk.
  • One of the drawbacks to plant-based products is the lower protein content and lower quality protein.  If a person is buying their milk for protein, dairy milk is the clear winner.

Is plant-based milk taking market share from dairy milk?  Where is it coming from?

Annual U.S. milk sales of skim milk have decreased by 4400 million pounds since 2013.  Annual plant-based milk has increased by 929 million pounds to 1979 million pounds per year during this same period.  

Whole and two percent fat milk have decreased by less than one percent per year over that last 10 years (Chart III).   In total, dairy milk has decreased by two percent per year over the last 10 years.  The main loss in dairy milk is in skim and to a lesser extent, one percent fat milk.

Chart III - Milk Sales by Butterfat

How does this impact butter churning?

Over 10 years, skim milk sales have decreased by 5000 million pounds per year and one percent milk has decreased by 2500 million pounds per year.  As a result of the decreasing sales, there is less butterfat that is removed from this milk, and it amounts to over 250 million pounds of butterfat annually at 2021 production levels.  

This amount of butterfat would produce over 300 million pounds of butter annually. In 2021, slightly over two million pounds of butter were produced in the U.S.  The loss in butter churned from butterfat that is no longer available from skim and one percent milk is about 15% of annual butter production.  Why do we have a butter shortage?  This certainly plays a part!

With the continued increase in plant-based milk and a decrease in low fat milk, the available butterfat will continue to decrease.  It appears that sales of plant-based milk is partially responsible for this decrease.

Summary

Plant-based milk is cannibalizing dairy milk sales and it is coming primarily from skim and one percent fat dairy milk.

The decrease in dairy milk sales is reducing the amount of butterfat available for churning butter.  In turn, this is contributing to shortages in butter churning and the resulting high prices for butter and butterfat.


Tuesday, November 15, 2022

De-pooling in the Upper Midwest has Shot Up!

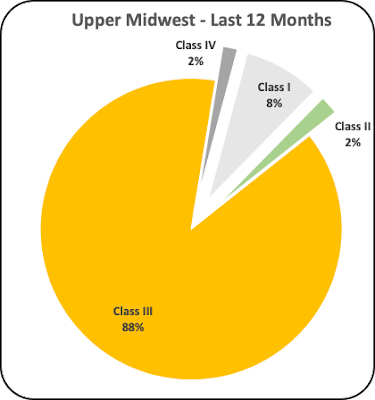
The May 2009, post to this blog covered de-pooling in the Upper Midwest.  A lot has changed in 13 years.  Charts I and II below show the comparison of 2009 and 2022 (the last 12 months ending in September 2022). The Upper Midwest is still primarily a Class III milk for cheese Federal Order.  However, the swings in Class I milk and de-pooling are huge.

Class I milk cannot be de-pooled, but all other milk can be de-pooled from the Order.

In 2009, Chart I, the Upper Midwest produced over 34 billion pounds of milk.  Of that total, two billion pounds were de-pooled.  Class I milk was in second place making up 15 percent of the pooled milk or 13 percent of the total milk.  Class III milk made up 77 percent of the pooled milk.

Chart I - Pooled Milk Marketed in the Upper Midwest in 2009

By 2022 (Chart II), 47 billion pounds of milk were produced, and 19 billion pounds of milk were de-pooled.  Class I made up only eight percent of the pooled milk or just five percent of the total milk produced.  Class III milk made up 88 percent of the pooled milk.

Chart II  - Pooled Milk Marketed in the Upper Midwest in
the most recent 12 months  

From 2005 to 2009, nine percent of the milk was de-pooled (Chart III).  In many months, no milk was de-pooled.

Chart III - Pooled and De-pooled Milk in the Upper Midwest

From 2018 to 2022, 40 percent of the milk was de-pooled.  In some months nearly 80 percent of the milk was de-pooled.  There were no months where no milk was de-pooled.

Chart IV - Pooled and De-pooled Milk in the Upper Midwest.

Why has the percent of de-pooled milk increased so much?  De-pooling typically occurs when the value of Class III or Class IV milk is higher priced than the "Uniform" or average price of the four classes of milk.  The de-pooling causes a lower or negative Producer Price Differential (PPD).  Below are some of the reasons that there is more de-pooling.

Less Class I milk lowers the Uniform price.

The current payment system was developed in the late 1900s and implemented January 2000. At that time Class I milk was the largest category of milk and the system was designed to keep Class I milk priced above the other classes.  With less high-priced Class I milk, the Uniform price will be lower.  

Chart V shows the percent of Class I milk in the Upper Midwest Federal Order.  It is well known that consumption of fluid milk is declining.  From 2005 to 2022 the percent of Class I milk in Upper Midwest declined very significantly from an average of 17 percent to just 5 percent. The decrease is a result of two factors, less Class I milk is being produced and more Class III milk for cheese is being produced.  It is a trend that is long-term, and it will continue and therefore, its impact on lowering the Uniform price is definite and will continue.

Chart V - Upper Midwest Percent of Class I Milk
(Includes Pooled and De-pooled Milk)

With less Class I milk, the average PPD has decreased by over $.10 per cwt.  Chart VI below lists the PPD from 2005 to the present.  PPDs that occurred during COVID are not shown as they were very abnormal.

Chart VI - The Upper Midwest PPD

De-Pooling Rules

De-pooling rules have not changed much.  De-pooling rules are unique to each Federal Order. The Upper Midwest can divert 90 percent of the milk delivered to a non pool plant and include it in the Federal Order pool.  This provides a lot of flexibility in de-pooling decisions 

Today, de-pooling is consistent monthly.  Some appears to be a routine process. 

WHAT DOES THIS MEAN TO DAIRY PRODUCERS?

What happens to producer prices when there is de-pooling.  De-pooling does not create more funds for producers. It only shifts the money around.  A simulation was made using data from January 2021.  There was a lot of Class III de-pooling in that month.  The PPD for the pooled milk was a negative -$.92 per cwt.  Those that de-pooled were paid more because they could avoid the negative PPD.  If the total volume of milk was pooled, assuming that those that de-pooled milk were paid at Federal Order rates, the negative PPD would be much lower.  If all the milk was pooled, the PPD would have been a negative -$.21 per cwt.  

By de-pooling, the additional money that moved to the pockets of those that de-pooled amounted to over $7 million in one month. Those that remained in the pool, paid the $7 million due to the high negative PPD of -$.92 per cwt.

Sunday, November 6, 2022

Are Producers Taking Advantage of High Butterfat Prices?

Butter and butterfat prices continue to escalate hitting record levels.  Are producers taking advantage of these high prices to increase revenue?  Technologies to increase butterfat in milk are known and many producers are taking advantage.  Genetics, feed, and diets balanced for amino acids can boost butterfat.  This post will cover where the U.S. stands in implementing the technologies to increase butterfat.

Table I lists the Federal Orders ranked by their percent butterfat calculated as 12-month moving averages.  Butterfat percent decreases in the heat of summer and 12-month moving averages eliminates this volatility.  Table II lists the Federal Orders by their improvement in the last 12 months.  There are no negative statistics in either table!

Does a high butterfat price encourage producers and their nutritionists to take steps to increase butterfat?  The answer is a clear YES.  By comparison, butterfat percent in milk increased by .07 percent in the last year while milk protein increased by .04 percent in the same time frame.  In 2020, as butterfat prices declined, butterfat percent increased by only .02 percent.

There are huge differences in butterfat production geographically.  The best in 2022 is the Pacific Northwest Federal Order with 4.24 percent butterfat.  The lowest is Florida with 3.67 percent butterfat, 13 percent lower than the Pacific Northwest. 

Table I - Butterfat Components by Federal Order
Listed by their 2022 Butterfat Percent

In terms of improvement, the Pacific Northwest again ranks at the top of the list and Florida ranks at the bottom.  Some that are ranked near the top in Table I, like the Southwest and the Upper Midwest have made only minimal to average improvements in 2022.  Because the gains and standings vary significantly, that leaves room for improvements in many areas.

Table II - Butterfat Components by Federal Order 
Listed by their Annual Improvement,

There is high demand for butter and inventories are low and prices are high (Chart I).  Butterfat is priced based on the wholesale price of butter.  The 12-month moving average of butterfat prices have been hitting new record highs every month.  With better prices, the percent of butterfat has increased above the trend line as producers react to the higher prices.  The overall improvement in butterfat is steady and is currently accelerating.

Chart I - Butterfat Percent and Price

The next four charts provide detail on four of the Federal Orders with unique and positive butterfat production.

California is ranked second behind the Pacific Northwest in growth in the last 12 months.  Chart II shows the gains made by California, up .12 percent in the last year.  California is the largest dairy state and the largest butter producing state.  Their improvement in butterfat helps the overall average, currently at .07 percent.  For more details on California butter production click here

Chart II - California Butterfat Percent

The Southwest Federal Order stands out in most all comparisons.  They rank second behind the Pacific Northwest in their butterfat content at 4.14 percent.  Unfortunately, since the beginning of 2022, there has been no improvement.

Chart III - Southwest Butterfat Percent.

The Southeast Federal Order is one of the four Federal Orders paid on the advanced system.  The other three are all ranked at the very bottom in Tables II.  The Southeast Federal Order has been able to increase butterfat by .07 percent and ranks in fourth place in improvement (Chart IV).

Chart IV Southeast Butterfat Percent

Starting 2021 and continuing through 2022, the Upper Midwest has increased butterfat.  Over the two years of growth, the Upper Midwest has increased butterfat from four percent to 4.09 percent.  This ranks the Upper Midwest at third place behind only the Pacific Northwest and the Southwest.  Prior to 2021, there was very little growth in butterfat percent (Chart V).

Chart V - Upper Midwest Butterfat Percent

Producers in all Federal Orders are paid for butterfat.  Butterfat is in very short supply and butterfat prices are at record highs. The companies that can help producers and their nutritionists to increase butterfat have a very strong window of opportunity with the extremely high butterfat prices.  The prices will likely begin to decline in 2023 but for some time will still provide a healthy ROI that will enhance a producer's revenue and finances.

Sunday, October 23, 2022

NDM Pricing is Important!

Based on a few questions from the prior post "Where are Milk Prices Headed in 2023," this post will detail the direction that nonfat dry milk (NDM) pricing is going.  Cheese is the most important parameter for producer skim milk pricing as it controls the skim Class III price and half of the Class I price. NDM controls all the skim Class IV, Class II, and half of the Class I price.

The domestic commodities butter, cheese, and dry whey are used to price butterfat, milk protein, and other solids. Their prices are primarily influenced by domestic wholesale inventories of these commodities.  The inventory levels are readily available.  NDM is primarily an export product and global inventory levels are not available.  That makes estimating future NDM prices more difficult.  

The pricing of NDM is also complicated by the fact that there are two very similar produces, NDM and skimmed milk powder (SMP).  Only NDM is used to price milk.  While the two products are similar, there are important differences. 

Some of the available data combines NDM and SMP.  The differences were defined in detail in a prior post.  NDM is defined by the USDA and is only a U.S. produced product.  SMP is defined in the "Codex Alimentarius" or "Food Code."  The Codex is a collection of international standards used to define products to ensure fair practices in food trade. The Codex standards are used by the World Trade Organization to settle disputes and assure uniformity in products.  The U.S. Agricultural Marketing Service (AMS) determines the price of NDM for use in pricing producer milk.  

The U.S. is primarily a producer of NDM with SMP making up less than ¼ of the total volume of NDM and SMP (Chart I).

Chart I - SMP as a percent of NDM/SMP

When the current Class and Component pricing system was developed prior to 2000, there were no significant exports of NDM/SMP.  By 2005, 22 percent of the NDM/SMP was being exported.  Today, over 70 percent of U.S. produced NDM/SMP is exported (Chart II).

Chart II - Percent Exports of NDM/SMP 

Therefore, to determine where the price of NDM is going, one must turn to international data.  Chart III below shows the 2021 through September of 2022 pricing of NDM and SMP from Europe, Oceania, South America, the West coast of the USA, and the prices determined by AMS.

Chart III - International prices of NDM/SMP and the AMS Price

While there are some differences in the lines above, there is consistency with lower prices through the first three quarters of 2021 followed by steep increases from the later part of 2021 though the first quarter of 2022.  Since then, all international and domestic price have dropped.  Will they continue to drop?

As shown in Chart IV, it is unusual to see price spikes for NDM as high a as they were is the first quarter of 2022.  In fact, there have been only two other high price spikes for NDM in the last 23 years and they both dropped back quickly.

Chart IV - AMS Pricing of NDM

NDM has the least volatility in its pricing compared to the three other commodities used to price milk.  That means it is less likely to make large pricing changes routinely.

Table I - Volatility Indexes

U.S. production of NDM/SMP has dropped in 2022 as shown in Chart V.  This has occurred because of the decrease in butter churning which was discussed in the September 11 post to this blog.  Lower production often means tighter inventories.

Chart V - U.S. Production of NDM/SMP

However, despite the decrease in butter churning and the decrease in production of NDM/SMP, NDM/SMP domestic inventories are not low.  The August 2022 inventories are larger than the August inventories of the prior two years (Chart V). 

Chart V - Inventory levels of NDM/SMP

What does this mean for the 2023 pricing of NDM and the pricing of skim Classes 1, II, and IV?  While international events can influence these prices, the above analysis indicates that NDM is already decreasing in price and will continue to decrease in 2023.

It is unusual for Class IV milk to be priced well above Class III milk.  In September 2023, Class IV skim milk was $4.98 per cwt. higher than Class III skim (Chart VI).  Further decreases in Class IV skim are very likely.

Chart VI - Class III and Class IV Skim Milk Prices


Monday, October 17, 2022

Where are Milk Prices headed in 2023?

This post will review the current and historical prices of Federal Order milk.  Based on the past, this post will predict where they may be going in 2023.  Class I base prices are currently at $22.71 per cwt., down from $25.87 per cwt in July 2022.  Class II milk is the smallest category and the highest priced at $26.51, close to its all-time high.  Class III milk is at $19.82 per cwt., down from its record price of $25.51 in May 2022.  Class IV milk is at $24.63 per cwt., near its record high of $25.31 in May 2022.  All Classes of milk hit record highs in the middle of 2022.  While some of these milk Classes are down from their record highs, they are still all good prices compared to historical prices.    

Classes I and III have dropped the fastest. Class III prices have dropped with the decrease in cheese prices.  Because Class I is linked partially to the Class III price, Class I milk also decreased.

Milk prices by Class since 2000

Commodity prices since 2000

The commodities used to price milk are cheese, butter, dry whey, and nonfat dry milk (NDM).  Prices of cheese, dry whey and NDM have dropped significantly since their mid-year highs.  Only butter continues to increase in price.

Cheese (Chart V) at $1.95 per pound is almost exactly at the long-term trend line.  As covered in a prior post, cheese production and inventories seem very much in line.  Through the yearend holidays and into 2023, cheese will likely stay near its current price.

Chart V - AMS Price of Cheese

Butter prices continue to rise, setting new record highs monthly.  The current price of $3.12 per pound is a significant high, nine percent higher than the prior high of $2.85 per pound set in September 2014.  The butter price impacts all classes of milk and is the most significant factor for the current high milk prices.  Through 2022 butter prices will likely set new record highs but in 2023, the price will likely begin to fall and when butter prices fall, they fall quickly (Chart VI).

Chart VI - AMS Price of Butter

Dry Whey is used to price "All Other" solids in Class III pricing.  Exports of dry whey to China, the largest dry whey importer, have doubled in 2022.  Unfortunately, in a matter of months dry whey prices plunged by 38 percent to $.49 per pound.

Chart VII - AMS Price of Dry Whey

NDM is primarily an export item.  Mexico and Southeast Asia are the main importers.  Sales to Mexico have increased in 2022 while sales to Southeast Asia have dropped.  Prices have dropped by 12 percent from March to September 2022.

Chart VIII - AMS Price of Nonfat Dry Milk

Component prices since 2000

The AMS prices of components are shown in Charts IX through XI below.

Milk protein prices are down for two reasons, lower cheese prices and higher butter prices.  Protein prices have dropped from a high of $5.62 per pound in November 2020 to the current $1.88 per pound, a drop of 67 percent.

Chart IX - Protein prices 

Butterfat is growing from a low of $1.32 per pound in April 2020 to the current price of $3.57 per pound, a 170 percent increase.  Will it fall as fast, or faster?

Chart X - Butterfat Price

Other solids make a small contribution to the Class III price.  The price of Other Solids is down to the long-term trend line growth level.

Chart XI - Other Solids Price

With concerns for declining economics globally, prices for dry whey and NDM are likely to continue to decrease.  A drop in NDM prices would have a significant impact as NDM is used to price Class IV skim, Class II skim and partially for Class I skim.

With butter the lone commodity with tight inventories and high prices, there will likely be a drop in demand and an increase in production.  Either or both will lower the price of butter and butterfat going into 2023.