Sunday, October 29, 2023

Where are Milk Prices Going?


Producer milk prices are based on the wholesale price of four dairy commodities: butter, cheese, nonfat dry milk (NDM), and dry whey.   The Agricultural Marketing Service does a weekly survey of these wholesale commodities.  At the end of the monthly period, those survey results are combined to calculate the price for butterfat, milk protein, and "all other" for Class III milk and Class IV skim milk.  The monthly periods are based on 4-week and 5-week averages.

Following the weekly surveys can provide an accurate prediction of month end prices for the milk solids listed above.  
________________

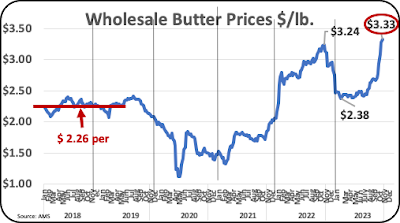
Butter prices are hitting record levels.  In early 2023 butter prices fell significantly, reaching a price of $2.38 per pound.  In the most recent weekly survey, butter prices hit a record high of $3.33 per pound.   The previous high for a month was $3.19 per pound in October 2022.  If a whole month was valued at $3.33 it would result in a producer price of $3.82 per pound for butterfat, which would be a record high.
Chart I - Wholesale Weekly Butter Prices
Clearly, maximizing butterfat production should be a top priority for milk producers.  Butterfat prices have been on a decades long increase.  With a trend that long, there is no reason to not take advantage of the record setting current prices.  See the prior post on the increased levels of butterfat in milk.
_________________

Cheese prices are key to Class III skim milk prices.  Milk protein is the major component in pricing Class III skim milk.  Unfortunately, as butter prices rise, milk protein prices decrease.  The formulas for protein pricing were also covered in the prior post.

The current weekly price of $1.71 per pound is not a bad price and is near historical prices.  The 24-year average price for cheese is $1.82 per pound.  Over the course of Chart II below, the average price was $1.80 per pound.
Chart II - Wholesale Weekly Cheese Prices
Cheese prices have shown relatively limited growth over the last 10 years as shown in Chart III.
Chart III - Cheese Prices Over the Last 10 Years
There is little reason to expect a major change in cheese pricing.
_________________

Other Solids are priced based on the price of dry whey.  Their contribution to overall producer milk pricing is minimal.  Currently, prices are relatively low.  Dry whey is a byproduct of cheese making and must be sold at prevailing domestic and international prices.  The supply of whey is only dependent on the volume of cheese production and must be sold at the current prices.

Chart IV - Wholesale Dry Whey Prices
_________________

The remaining commodity is NDM.    It's pricing is used to price Class IV skim milk and in turn is also used to price Class II skim and partially price Class I skim.  The market is primarily international sales with sales to Mexico, a valuable customer.

Chart V - Wholesale NDM Prices

The current price of $1.16 per pound is close to the 6 years average price of $1.17 per pound for the period shown in Chart V.
_________________

In summary, the commodity that is exhibiting the best price and the best price growth is butter.  As a result, the milk solid to emphasize is butterfat.  As mentioned in the prior post there are many techniques to increase butterfat.  Balancing amino acids is one technique that can also improve milk protein and cow health. 

Sunday, October 15, 2023

Sustainablilty and Making Money

The new buzzword for the dairy industry is sustainability.  The USDA defines sustainability as "Sustainable agriculture is farming in such a ways to protect the environment, aid and export natural resources and to make the best use of nonrenewable resources."  Dairy needs to provide food that is desirable, healthy, and affordable.  U.S. dairies are doing just that.  Today's dairy products primarily need healthy components, like butterfat and protein.  When the amount of these components in milk increases, the needed components can be supplied with fewer cows and at lower cost.  This post will cover the trends that accomplish these requirements.

The data used in this post is Federal Order averages.  Individual producers do achieve significantly higher levels of components. 

BUTTERFAT

Chart I shows the trends in butterfat production as a percent of milk.  The increases are steady and ongoing.  How long can these trends continue to grow?  The gains are clearly not slowing down.  From the beginning on 2018 to the most current month of August 2023, butterfat in milk has increased from 3.83% to 4.09% (Chart I).

Chart I - Average percent of Butterfat in Milk

The increases in butterfat volume are growing by over 1% annually (Chart II).  A producer with 3000 cows with each producing 30,000 pounds of milk annually would get 36,000 more pounds of butterfat than the prior year.   

90,000,000 pounds of milk with 4% butterfat and increasing butterfat by 1% annually = 36,000 more pounds of butterfat annually

The increase builds annually.  If at 4% butterfat, a one percent increase would make the butterfat percent go to 4.04% and the next year to 4.08% etc. Using protein's current price of $3.13 per pound, the producer would get $113,000 more revenue than the prior year with no additional cows.

Chart II - Annual Percent Growth in Butterfat
The Federal Orders with the highest and lowest percent butterfat are listed below (Table I).  The four with the lowest butterfat content are the four Federal Orders paid on the Advanced prices.  These four do get paid for their butterfat just like those paid on the Class and Component prices.
Table I - Butterfat Percent
by Federal Order
MILK PROTEIN

Milk Protein has also seen similar increases in production.  Over the last three years, protein volume in milk has grown by 1% annually, increasing protein levels from 3.15% at the start of 2018 to the present at 3.24% (Chart III).
Chart III - Annal Percent of Protein in Milk
What is that worth?  Following the math used for butterfat above, with 3000 cows producing 30,000 pounds of milk annually the producer would get a revenue increase of $67,000 annually.

(90,000,000 pounds of milk with 3.26% protein with a 1% increase over prior year = 29,000 more pounds of protein)

Priced at the current price of $2.30 per pound, the producer would get $67,000 more revenue than the prior year based on increased protein production.  This would be cumulative every year.

Chart IV - Annual Percent Growth in Protein

Protein is paid for in the seven Federal Orders paid on the Class and Component system.  As shown in Table II, the .23% spread between the seven Orders is relatively small, compared to the .54% spread for butterfat shown in Table I.

Table II - Protein Percent
by Federal Order
SOMATIC CELL COUNT

Somatic Cell Count (SCC) is included in the published component data and will therefore be included in this post.  Since the SCC broke the 195,000 cells per milliliter level, there has been no significant improvement in lower SCCs.  The Upper Midwest and the Mideast have the lowest SCCs at 178,000 somatic cells,
Chart V - Average Somatic Cell Count

SUMMARY

The gains in volume for butterfat and protein are a tremendous improvement for both sustainability and for improved producer revenue.  There are various technics for improving butterfat.  There is one main improvement for increasing milk protein and that is amino acid balancing cf feed.  Amino acid balancing also improves butterfat volume creating a combined return on the investment for feeding the proper level of needed amino acids.  The technology has been practiced for a long-time and is well proven.

Sunday, October 8, 2023

Dairy Prices Show Some Improvement in 3rd Quarter

Producer milk prices have fallen tremendously in 2023.  The big question is "When will prices improve to make milk production profitable again?"  The reasons for the fall in prices was covered in a recent post.  This post will look to the future to see when and by how much producer milk prices may increase.  The volatility during the span of data in this review is tremendous.  Three-year trends and quarterly price changes will be reviewed in this post. 

Butterfat prices have been a big contributor to the producer milk price and will be reviewed first.  Butterfat values increased tremendously in 2021 and most of 2022.  Then butter consumption declined (see the September 10 post) and the Butterfat price declined by 25% in three months.  Recently producer butterfat prices have started increasing and may reclaim the higher prices in the fourth quarter of 2023.

Chart I - Butterfat Prices for 2022 through 2023
Butterfat prices grew tremendously in late 2021 and all of 2022 (Table I).  Immediately in 2023 the prices dropped and have remained around $2.74 per pound for the first six months.  In the third quarter of this year the butterfat prices started increasing.  This will likely continue in the fourth quarter and will reach $3 per pound pricing.  This increase will be a strong factor for all dairy producer pricing in 2024.
Table I - Quarterly Butter Prices for
2021 Through YTD 2023

Protein prices have dropped continuously in 2021 to 2023.  This is partially caused by increasing retail butter price. From the highs in May 2022 to the lows in July 2023, the value of milk protein decreased by 70%.  However, from July to September 2023, prices nearly doubled (Chart II).  The question now is "Will the future months continue to increase?", or will they follow the overall decline of the last three years?

Chart II - Milk Protein Prices for 2022 through 2023

Table II compares the quarter-by-quarter milk protein prices from the prior year.  Cheese prices, which largely control the protein prices are relatively stable with the prior year.   As butterfat prices increase, milk protein prices decline.   Below is the simplified formula for pricing milk protein.

Milk Protein = 3.22 x AMS cheese Price - 1.05 x AMS butterfat price - $5.65

The current milk protein prices indicate no further decreases or increases with pricing stability for the near future.  

Table II - Quarterly Protein Prices for
2021 Through YTD.2023
Nonfat dry milk (NDM) prices peaked in 2022 with 62% increases from January 2021.  With the formula changes implemented in May 2019, NDM milk prices influence the skim prices of Class I, II, and IV milk.  The NDM price is controlled by international prices as the majority is exported.  The decrease in international demand for NDM and skimmed milk powder have lowered prices    Until the international dairy market stabilizes prices will remain low but stable.
Chart III - Nonfat Dry Milk Prices for
2022 through 2023
Table III - Quarterly NDM Prices for
2021 Through YTD 2023
In summary, producer milk prices are headed upward with further increases in butterfat prices and stability in protein and NDM prices.  This should increase producer milk prices, but the prices changes will be small.