Sunday, September 24, 2023

Exports of Cheese and Butter are Down. What Countries are Buying and What Ones are not?

Cheese and butter exports are down significantly.  This is contributing to the downturn in demand for producer milk.  Cheese exports are down less as a percentage than butter exports.  Data used in this post is based on July YTD data for 2023 compared to the same period in 2022.

Table I below shows where the cheese exports are down and where they are up.  Overall, through July 2023 exports of cheese are down 6%.  Previously cheese exports were growing.  There have been major decreases in imports from many countries.  The largest major loss was in cheese exports to South Korea.  South Korea has been the second largest importer of U.S. cheese, and their imports are down by 44% in 2023.   Japan has been the third largest importer of U.S. cheese, and their purchases are down 14%.  Listed below are many other countries with lower purchases.  In total, for the 10 countries listed below, exports to date are down 32% which amounts to nearly 83 million pounds of cheese.

The losses in cheese exports to the listed 10 countries is partially offset by increases from other countries.  The largest of these is Mexico where imports are up 13% over the prior year.  The 20 million pounds increase helped offset a lot of the losses from other countries.  China has more than doubled their imports of cheese.  The five countries with the biggest increases in exports are listed below and together increased purchases of cheese by 49 million pounds.  

The overall cheese exports are down 36 million pounds in the first 7 months of 2023.  The volume of cheese exported declined from 7.1% of cheese production in 2022 to 6.7% in 2023.  That reduced the need for producer milk by 3,600,000 cwt.

Table I - Changes in Cheese Exports from
2022 to 2023 YTD July
Canada is consistently the largest importer of butter from the U.S.  In 2023 YTD, 66% of butter exports went to Canada. Mexico is the second largest importer of butter, but their share of purchases dropped to just 10% of total butter exports in 2023 YTD.

Butter export decreases are much bigger than the decrease in cheese exports, dropping by 46 million pounds which amounts to a 45% decrease in butter exports (Table II).   While Mexico bought 20 million more pounds of cheese, they bought 12 million fewer pounds of butter.  Bahrain, which is a small country with a population of about 1.5 million people, eliminated purchases of U.S. cheese starting in December 2022 and have bought almost no butter since then.  The countries listed here have all decreased imports in excess of one million pounds in 2023.  There were no countries that increased butter purchases by over one million pounds in 2023.  Exports of U.S. butter decreased from 8% of butter production to 4% of butter production in 2023.  That reduced the need for producer milk by 9,752,000 cwt. of producer milk.
Table II - Changes in Butter Exports from
2022 to 2023 YTD July
The combined export decreases of producer milk needed in 2023 vs. 2022 is about 13,352,000 cwt of milk or about 1% less producer milk needed.

The data used in this analysis is based on the Federal Government DataWeb for Trade and Tariff Data.  It is based on the NAICS code 311513 for cheese and code 311512 for creamery butter.  Other sources and codes exist and therefore some published data may show slightly different analytics. 


Sunday, September 17, 2023

The Real Reason for Slower Dairy Milk Demand and Lower Producer Prices!

The prior two posts covered the lack of growth in milk demand and slowing sales of fluid milk, cheese, and butter.  This post will show why retail sales of dairy products are slowing down demand for producer milk.  As will be shown below, retail prices of the major dairy products has escalated tremendously in 2022.  Fluid milk is a necessary buy in many households, but competition from nondairy "milk" is hurting sales.  The downturn in fluid milk sales has been going on for decades and there seems to be no slowdown in this trend.  Cheese and butter are not a necessary buy.  If prices go up, there is elasticity of demand and there has been huge retail price increases in 2022 causing a decrease in retail purchases.  This is why there is a downturn in milk demand!

Retail prices used in this post are from the Bureau of Labor Statistics (BLS).

FLUID MILK

As covered in the prior post, fluid milk sales increased in 2020 as the "stay at home" mandates required workers to stay at home, and they probably ate more cereal with milk.  Retail milk prices increased from the 2018 average price of $2.90 per gallon to a high of $3.31 per gallon in 2020, a 14% increase.  With the sudden change in eating habits, that is understandable.  But after the mandates were dropped, the prices did not drop back to 2018 levels but kept growing.  The average price in 2022 was $4.09 per gallon, another 23% higher.  The inflation in fluid milk prices over five years is 41%!

There is some slight moderation of prices in 2023 with a drop in retail fluid milk prices of 4% vs. the prior year.

During this time, Class I milk prices ranged from $1.73 in 2018 to $2.75 in 2022 an increase of 59%.  

The decreasing consumption as covered in the prior post shows an annual decrease of consumption of slightly over 2%, which is where it has been in prior years.  There is very limited price elasticity of demand in fluid milk.  User will buy regardless of the price.

Chart I - Retail Fluid Milk Prices per Gallon
Chart II - Annual Retail Price Changes in Percent's

 CHEESE 

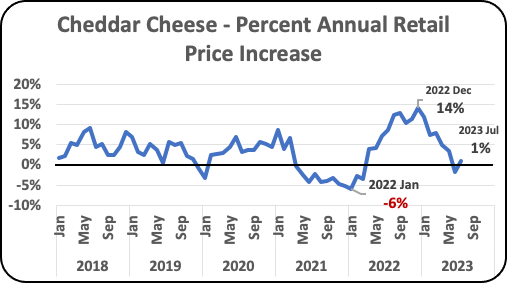
Cheese is a very different story.  Average cheddar cheese prices increased by 15% in 2022.  The volume of disappearance from wholesale inventories in 2022 (as a leading measure of consumption) decreased by 6%.  That is elasticity of demand.  As prices go up, sales go down.  The price of cheddar cheese peaked at $6.08 per pound, a record high.

Chart III - Price per Pound for Cheddar Cheese
Chart IV - Retail Price Changes in Percent's

In 2021, the average price of Class III milk for cheese was $17.08 per cwt.  In 2022, the average price was $21.96 per cwt., a 29% increase.  In May 2022, the Class III price peaked at $25.21 per cwt., a record high.

BUTTER

Average butter prices in 2021 were $3.59 per pound.  In 2022, the average price jumped to $4.38 per pound, a 22% increase.  On a month-to-month basis, from January 2021 to January 2022, retail butter prices increased from $3.67 per pound to $4.88 per pound, a 33% increase and a record high.  These were major price increases and as covered in the prior post, domestic withdrawals from wholesale inventories dropped by 8% reducing the demand for butterfat.  There is price elasticity of demand for butter and as prices climb, sales decrease.

Chart V - Butter Retail Prices

Chart VI - Retail Price Changes in Percent's

The increases in the Agricultural Marking Service (AMS) butter prices used to price producer milk increased by 22% during the short interval between January of 2022 to October of 2022.  The AMS butter price reached a record high in October 2022 of $3.19 per pound.

THE BOTTOM LINE

A quick take on the analytics above shows that the high producer revenues in 2022 brought the retail price increases and thereby dampened consumption and the demand for milk.  All the numbers above are very volatile and have been influenced by COVID lifestyle changes followed by inflation.  

By comparison, the overall consumer price index (CPI) is now 3.7% for the last 12 months and the food CPI is 4.3%.  Both increased in August, the most current data.  However, all the CPI statistics are much smaller than the BLS retail price increases of dairy products discussed above.  Dairy producer prices have always been volatile.  The BLS retail dairy prices listed above indicate that retail dairy price levels are being tested and changed regularly to ensure good revenue at the retail level.

Sunday, September 10, 2023

Why is Milk Production Shrinking?

The prior post covered the shrinking demand for producer milk.  Demand for producer milk is not growing.  This post will examine the details causing the lower demand for milk.

The possible reasons cited for no growth in the previous post were lower domestic consumption of dairy products like fluid milk, cheese, and butter and/or lower exports of key dairy products.  This post will examine the growth trends of these dairy products that can change demand for producer milk.

FLUID MILK

Fluid milk consumption has been shrinking for decades.  Charts I and II below show the changing demand for fluid milk in pounds of milk sold and percent changes from the prior year.  Fluid milk sales were decreasing by about 2% annually prior to the disruptions from COVID policies.  The COVID mandates changed the norms as people working from home consumed more milk, probably for cereal.  However, as the "lock downs" were lifted, sales plunged.  The current decline in pounds fluctuates around 500 million pounds annually and the percent decline is now reappearing around 2% annually.

The current decline is really a continuation of a very long trend, but it does add to the overall decline in demand for producer milk.

Chart I - Fluid Milk Sales for First Half of
Years of 2017 Through 2023
Chart II - Fluid Milk Percent Change from Prior
Year for First Half of Years of 2017 through 2023

CHEESE

Cheese production is the largest use of producer milk.  The growth of cheese domestic consumption, as expressed in cheese withdrawals from inventory for domestic consumption, ranged around 2% to 3% annually from 2017 to 2019 (Chart III).  When COVID "stay at home" policies were imposed, sales became stagnant with no growth.  After the "stay at home" policies were lifted, cheese sales were again increasing at near normal rates.  

Then, sales withdrawals dropped drastically starting in 2022.   In March of 2023, domestic withdrawals from inventory dropped by 3.6% from the prior year (Chart III).  What could cause this?  Were inflationary prices responsible?  Diary product retail pricing will be covered in an upcoming blog post.

In the first half of 2023, exports of cheese also began falling (Chart V), wiping out another four million pounds per month of demand.  While cheese exports are important, they make up only about 7% of the total demand for cheese production (Chart VI).  The drop of four million pounds per month in exports is minor compared to the 43 million pounds per month drop in cheese withdrawals for domestic consumption.  

The decline in domestic consumption dropped by 4% and the drop in exports dropped by 5%.  The declines were very significant and unusual compared to prior trends.

Chart III - Volume of Cheese Withdrawals From
Inventory for Domestic Use
Chart IV - Percent of Domestic Cheese
Disappearance vs. Prior year
Chart V - Cheese Export Volumes
Chart VI - Percent of Domestic vs. Exports of Cheese
BUTTER

Butter demand (Chart VII) has seen a similar pattern of decreased demand in 2022 and early 2023 as withdrawals dropped by 16 million pounds per month.  Chart VIII, which expresses the decline of domestic butter demand in annual percent's, shows the decline started in 2020 and continues through early 2023.  The current decline vs. the prior year is only a 1% decline, but it is still a decline.

Butter exports are also down (Chart IX).  The export impact on overall demand is minimal as exports account for only 3% of overall demand (Chart X).

Chart VII - Volume of Butter Withdrawals From
Inventory for Domestic Use
Chart VIII - Percent of Domestic Butter
Disappearance vs. Prior year
Chart IX - Butter Export Volumes
Chart X - Percent of Domestic vs. Exports of Butter
SUMMARY

The lack of growth in producer milk volume is caused by drops in all the major product categories.   Fluid milk, cheese, and butter all dropped in domestic consumption.  The fluid milk drop is measured in retail sales and is at an ongoing level.  Almost no fluid milk is exported so exports do not come into play.  The decline can best be characterized as a change in eating habits where fluid milk in competing with many other fluid products offered.  

Cheese and butter both had declining domestic withdrawals from wholesale inventories.  There are two possible causes.  The most likely cause is based on inflationary pricing.  However, the health awareness of saturated fats may also be a factor.  See this earlier post on butter vs. margarine. 

The next post will review retail pricing.  Is inflation causing a decrease in sales?


Monday, September 4, 2023

U.S. Milk Production is Not Growing!

U.S. milk production is not growing.  In the past, growth of 1 to 2 percent was required to supply demand, especially for the increasing consumption of cheese.  Now almost no increase in milk production is needed.  

For reference, the largest milk producing states are listed below.  The numbers are based on 2023 YTD data.  Idaho retains third place over Texas with strong growth starting in mid 2022.

Million Pounds of Milk
July YTD 2023

Chart I below shows the change in milk production over the last five years.  Milk production started slowing in mid 2021.   The monthly range, high to low, since then has been less than 1%.  Chart I is based on 12-month moving averages to reduce monthly volatility.  The U.S. is now growing the milk supply by less than .5% annually

Chart I - U.S. Milk Production From the
Start of 2019 to the Most Current Data Available.

What states have been impacted the most?  Below are tables listing the states that have gained in milk production and those that have lost milk production.  Comparing 2023 to 2022 YTD, there was an increase of 666 million pounds of milk, which is an increase of just under .5% compared to the prior year.

States with the largest Increases and Decreases 
in Milk Production - Million Pounds - July 2023 YTD

Dairy cow counts have decreased since peaking in May of 2021.  The decline is about 1%.  The increased milk produced per cow has been able to keep the milk supply stable with fewer cows.

Chart II - U.S. Dairy Cows From the 
Start of 2019 to the Most Current Data Available
.
Cow numbers did increase slightly comparing 2022  and 2023 YTD July.  California which had by far the largest decrease in milk production has reduced almost no cows.  Florida did reduce their cow herds by 53,000 cows.
States with Increases and Decreases 
in Cows (000)
What is causing the change to almost no annual increase in milk production?  The decrease can be coming from competition from plant based "milk," and/or from lower exports, and/or from lower domestic consumption.  The following items will be covered in upcoming blogs.

In the March 12, 2023 post to this blog, the FDA's draft to allow plant based "milk" to be branded as milk was covered.  Some grocery outlets are now mixing plant based and dairy based products in the milk section.  The nutritional differences seem to be ignored on the grocery shelf.  Fluid diary milk consumption has been falling for years and the decline may be accelerating. 

The year 2023 has been tough on exports.  It is difficult to find a good price for international sales of nonfat dry milk.  More data on this will be forthcoming in a future blog.  New Zealand has a huge export market and has established brand names for different locations, different languages, and different customers.  Should a program like that be developed for the U.S.?

Domestic cheese consumption, which is the largest use of milk, has been growing at about 2% annually.  Where is cheese consumption now?  Does it need more marketing?  Countries like France and Italy have a much higher per capita consumption rate for cheese.  Is there something there that can be implemented in the U.S.?