Sunday, January 30, 2022

The Shifting Fluid Milk Market is Reducing Butterfat Availability!

In the January 10 post to this blog, the shortage of butter production was reviewed.  There were two specific reasons mentioned in various press releases that were covered in the blog, a slow down in milk production and logistics.  However, there is one additional dynamic in the dairy industry that is also influencing the availability of butterfat.  This post will review the influence of how the decline of fluid milk is also influencing the availability of butterfat. 

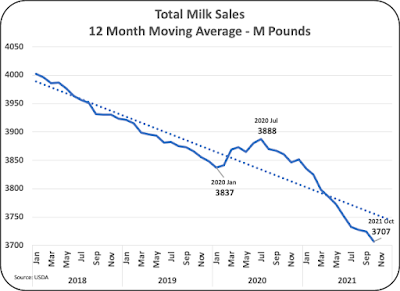
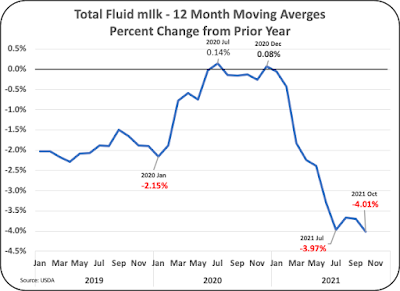
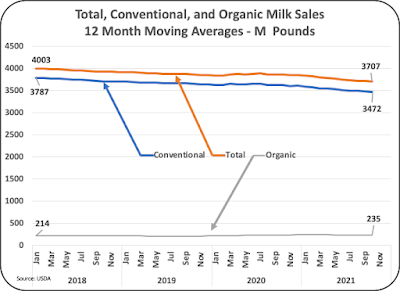
In the January 22 post to this blog, the decrease in fluid milk was covered.  As less fluid milk is produced, there is less butterfat removed and available for various products containing butterfat.  The mix of the fluid milk decline is also important as lower fat milk is declining faster than whole or two percent fat milk.

When fluid milk is produced, the first step is to remove all butterfat with a cream separator.   The proper amount of butterfat is then added to the milk to meet the label requirement.  Whole milk must contain 3.25 percent butterfat followed by two percent and one percent fluid milk.  Fat free milk gets no butterfat added.  Currently, butterfat in producer milk is nearly four percent butterfat.  The dynamics of the available butterfat left from fluid milk production include the following:

  • The amount of butterfat in milk is increasing.  (See the Oct 24, 2021 post to review component levels over time.)  Therefore, more butterfat should be available.
  • Fluid milk sales are declining, making less butterfat available.
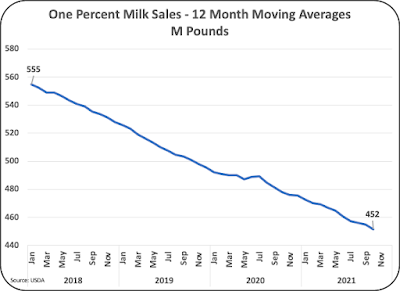
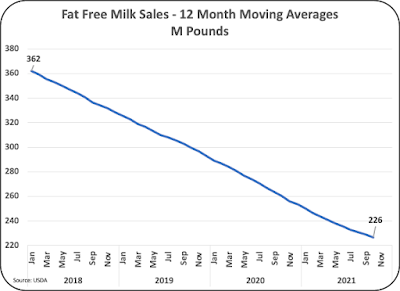
  • The mix of fluid milk is changing.  The products that allowed the most butterfat to be harvested are one percent fat and fat free milk.  These two categories of milk are declining the fastest.

In this analysis, whole milk includes both regular milk and flavored whole milk.   Two percent milk also includes "flavored fat reduced" milk.  Data for one percent fat and fat free milk are taken as reported.  This analysis includes both conventional milk and organic milk.  The years 2017 and 2021 are compared below.  During this time, butterfat in milk grew from 3.8 percent to 3.95 percent and that is also taken into consideration in this analysis.  

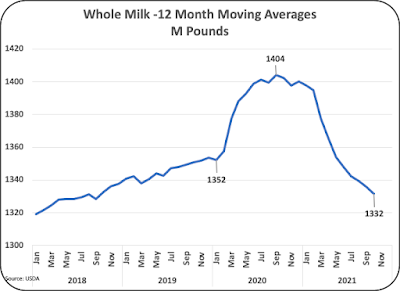
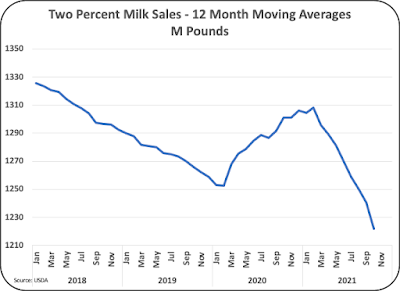
Chart I below compares sales of fluid milk from 2017 and 2021.  Whole milk has maintained steady sales.  There has been an 11 percent drop in two percent fat milk, a 20 percent loss in one percent fat milk and a 40 percent drop in fat free milk sales.   

Chart I - Milk by category for 2017 and 2021

Chart II is a pie chart of the milk categories in 2017.  Overall fluid milk sales amounted to 48 billion pounds of milk in 2017.  All other milk which includes buttermilk and other dairy products accounted for only two percent of sales.

Chart II - Mix of Milk Products in 2017

By 2021 (Chart III) , the pie chart has shifted significantly.  One percent fat milk has dropped from being 16 percent of the mix in 2017 to 12 percent in 2021.  Fat free milk has dropped from nine percent of the mix to six percent.  Whole milk has maintained sales and has increased its share from 34 percent to 38 percent of the mix due to the overall drop in sales to 44 billion pounds.  From 2017 to 2021 fluid milk sales have decreased by eight percent.

The "All Other" category has increased from two percent to four percent with the addition of niche products like Fairlife milk.

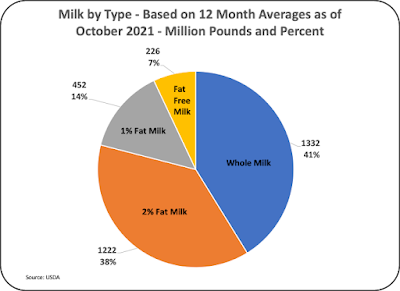
Chart III - Mix of Milk Products in 2021

Table one below quantifies the impact of butterfat available from fluid milk.  The higher component levels of butterfat are offset by the drops in volume and the changing mix of fluid milk sales.  The amount of excess butterfat from fluid milk has been reduced by 119 million pounds.  That would produce about 155 million pounds of butter.  While some of the butterfat from fluid milk is used in other dairy products like ice cream, it does represent a drop in total available butterfat for butter churning.  

Milk received is based on the skim milk in fluid milk sales plus the butterfat in producer milk based on the butterfat percent in that year.  Butterfat used is based on the percent of milk in the four classes of fluid milk.  The excess butterfat is the difference between butterfat in the milk delivered and the butterfat used to meet the label requirements for fluid milk.

Table I - Impact on Butterfat Availability from Fluid Milk

Is 101 million pounds of butter from the excess butterfat in fluid milk a significant amount?  Chart IV shows the annual butter production from 2017 to 2021.  From the high of 2145 million pounds of butter produced in year 2020 to the 2069 million pounds of butter produced in year 2021, there is a 76 million pound drop.  From the low of 1847 million pounds in 2017 to the current level of 2069 million pound in year 2021 there was an increase of 222 million pounds of butter.

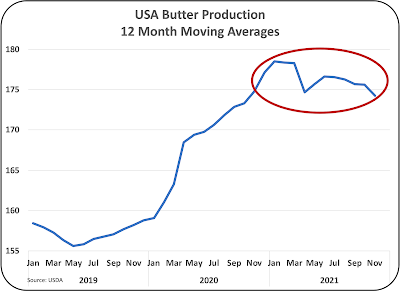
Chart IV - Annual Butter Production

Is 101 million pounds of butter from the excess butterfat in fluid milk a significant amount?  YES!

The next post will make projections of milk usage through 2030.  The growth is all in products that require milk components.  Component increases in producer milk is what's needed for the growing dairy products.  It is also what increases revenue for producers.  


Saturday, January 22, 2022

Milk Production - Some States are Growing, and Some are Shrinking.

As covered in the prior post, milk production in 2021 has slowed down (Chart I).  In early 2021 there was continued steady growth of milk production, but in the last half of 2021, production has leveled out.  This post will examine milk production by state.  Some states are growing, and some are shrinking.  Data in this post is based on the years 2018 to 2021 through November.  Much of the analysis is based on 12-month moving averages used to reduce volatility and seasonal changes, allowing a better perspective of long-term trends.

Chart I - Total U.S. Milk Production

Table I below lists the 10 largest milk producing states.  The 10 states listed below produced 74 Percent of the U.S. milk in 2021.

Table I - The 10 Largest Milk Producing States
 
The three largest milk producing states, California, Wisconsin, and Idaho, account for 40 percent of the milk produced in the U.S.  Adding New York, and Texas, the top five states account for over 53 percent of the U.S. milk.  Milk production and use in the three largest states will be reviewed in more detail below.  The final part of this blog post will review the three-year growth statistics and the 2021 growth and shrinkage statistics of milk production by the fastest growing and fastest shrinking states.

CALIFORNIA

California is by far the largest milk producing state in the U.S.  California had a sudden flattening of milk production starting in mid 2021.  California fluid milk consumption has been decreasing, some cheese production has left California, and butter production is currently limited by logistics and the milk supply.

Chart I - California Milk production

California cheese production (Chart II) began dropping in 2020 and has somewhat leveled off in 2021.  With less cheese production, there is less milk needed.  Between the end of 2019 and November 2021, cheese production has dropped by four percent.  See this recent post for more details on cheese production.

Chart II - California Cheese Production

Fluid milk sales (Chart III) were robust in California in 2019 but began dropping in 2020.  The decrease in fluid milk sales has continued in 2021 also decreasing the need for producer milk.  Between the peak at the end of 2019 and November 2021, fluid milk sales have decreased by nine percent.

Chart III - California Fluid Milk Sales

Butter production is a major factor in California.  (See this recent post on butter production for details.) Butter production grew in 2020 but leveled off in 2021.  There have been very few increases in butter production in California throughout 2021.  The losses in fluid milk and cheese should make more milk available for increases in butter production.  To date, this has not happened.

Chart IV - California Butter Production

WISCONSIN

Wisconsin milk production has grown by nearly four percent between late 2020 and November 2021.

Chart V - Wisconsin Milk Production

Wisconsin cheese production (Chart VI) and Wisconsin milk production (Chart V) are very similar, and they should be as the vast majority of Wisconsin milk is used for cheese.  Milk production grew by four percent and cheese production grew by three percent.  This should leave sufficient milk for cheese production as consumption of cheese continues to grow. 

Chart VI - Wisconsin Cheese Production

Fluid milk sales make up most of the remaining use of milk in Wisconsin.  Fluid milk sales are not reported specifically for Wisconsin, but likely follow the trends shown in Chart VII for the Upper Midwest region.  Sales of fluid milk in the Upper Midwest are falling at the rate of about three percent annually.

Chart VII - Upper Midwest Fluid Milk Sales
IDAHO

Idaho has seen a healthy growth in milk production of about 2.5 percent annually over the last three years.  However, the growth has slowed down somewhat in 2021.  Idaho is not in a Federal Milk Marketing Order and therefore some data is not publicly available.

Chart VIII - Idaho Milk Production

Cheese production in Idaho (Chart IX) increased by 2.5 percent between the start of 2019 and April of 2021.  However, starting in May of 2021 cheese production fell by over one percent leaving a three-year gain of only one percent.  Idaho is also home to production of a variety of milk powders.

Chart IX - Idaho Cheese Production

Table II below lists the 10 largest states by the size of their increase in milk production from 2018 to 2021.  The four states with the most growth, Texas, California, Idaho, and Wisconsin respectively, make up 62 percent of the overall increase in the last three years.  Texas has sustained the largest growth in pounds and has increased milk production by 20.8 percent over three years.  As covered in this and other posts, Texas is rising as a major dairy producing state and will likely pass New York to soon become the fourth largest dairy state.

In terms of growth percent, Georgia really stands out.  States in three of the four Federal Orders paid on the Advanced system have had significant decreases in milk production as they are very dependent on fluid milk sales that are declining.  Georgia, part of the Southeast Federal Order, had a 43.7 percent growth over three years. The state has emphasized improved productivity by various programs.  The growth rate of Georgia milk has slowed to just one percent in 2021, but that is still much better than the decreases in fluid milk consumption.

Table II - The Ten States with the Largest Gain in
Milk Production from 2018 to 2021 YTD. 

Table III lists the most recent growth from 2020 to 2021.  Wisconsin, Texas, and California remain at the top of the list.  South Dakota had a very significant increase of 14.7 percent with the expansion and addition of cheese plants.  Georgia dropped out of the top ten in 2021 with only a one percent increase.

Table III - The Ten States with the Largest Gains in
Milk Production from 2020 to 2021 YTD

Table IV lists the six states with the largest losses in pounds of milk production.  States with a large dependence on fluid milk have suffered.

Table IV - The Six States with the largest Loses in Milk Production

Over the course of the last six months, there have been four posts on where dairy is moving and why it is moving.  See these posts for more details.

Monday, January 10, 2022

Butter - What is Happening to Supply and Prices?

This post will cover the recent surge in the price of butter.  Butter prices as determined by the Agricultural Marketing Service (AMS) are used to price producer butterfat.  Recently, butter production has dropped, wholesale disappearance and exports have increased, inventories have tightened, and prices have increased.  

When butter prices increase, butterfat prices increase, milk protein prices decrease, and the Class III price is only slightly impacted as covered in this recent post.

USA production of butter was variable in 2020 with the massive changes in eating habits caused by COVID mandates.  However, butter production grew nicely overall in 2020 as shown in Chart I. At the start of 2021, monthly butter production peaked.  By November of 2021, monthly production was down 26 percent from the start of 2021.

Chart I - Butter Production 12 Month Moving Averages

Domestic disappearance from wholesale inventories has grown throughout the span of this analysis and  this growth has accelerated in 2021.

Chart II - Domestic Disappearance 12 Month Moving Averages

Net exports have remained minimal but are currently positive with an increase in butter exports.  The current 12-month average is the first positive 12-month average for net exports since 2015.

Chart III - Net Exports 12 Month Moving Averages

With the combination of lower production, strong domestic disappearance, and positive net exports, inventories have decreased, and prices have increased.  Chart IV shows the relationship based on 12-month averages.  When wholesale supplies decrease, wholesale prices increase.  The most recent monthly price of butter is $2.06 per pound.

Chart IV - Inventories and Prices of Butter

What is causing this?  The explanation will start with where butter is produced.  Chart V is a pie chart that shows production by the two biggest butter producing states.  California and Pennsylvania butter production are reported over the span of this analysis and all other state butter production is considered too small to report.  California produces more than one third of the total U.S. butter, and that butter is shipped throughout the U.S.  The percent of the USA butter produced in California has increased from 30 percent at the end of 2018 to 34 percent near the end of 2021.

Chart V - Butter Production by Location

Production of butter in California is shown below in Chart VI.  There was significant growth in California butter production through 2020, but in 2021, butter production leveled off with almost no growth.  This chart is very similar to the Chart I which shows butter production for the U.S.  The one big difference is that butter production in California "leveled off" while the USA butter production decreased.  Annual butter production in California has grown by 17 percent between 2018 and 2021.  By comparison, the annual U.S. butter production has grown by just 10 percent during this same time span.  

With Class I milk for drinking and Class III milk for cheese declining in California, the increase in butter churning is offsetting the declines and providing a home for California milk production.

Chart VI - California Butter Production 12 Month Moving Averages

Recent press releases have blamed the decreasing butter inventories on logistics and a lack of milk production. The impact of logistics is difficult to analyze, but certainly butter is moved long distances and there is a shortage of drivers for moving products across the USA. Data for milk production is readily available.  As shown below, the USA milk production has shown a recent slowdown in growth (Chart VII). 

Chart VII - USA Milk Production 12 Month Moving Averages

California milk production has followed the USA chart above, except that California milk production grew faster in early 2021 and then abruptly "leveled off."

Chart VIII - California Milk Production 12 Mont Moving Averages

From this data, it looks like milk production has certainly reduced availability for churning.  Until there is a change in milk production, butter production and inventories will likely keep butter prices high.  

Cheese has not been impacted as severely by the milk shortage, as the milk production in Wisconsin, Texas and Minnesota has continued to grow.  For a review of the major cheese producing states, see this post.

The impact of milk production by state will be analyzed in the next post to this blog.


Sunday, January 2, 2022

How are Fluid Milk Sales Going? DOWN!

This Post will cover the trends in sales of fluid (drinking) milk in the U.S.  This is an update from the February 21, 2021 post to this blog.  

Fluid milk sales have been declining at about two percent annually prior to 2020.  In 2020, there was a significant increase in milk consumption as eating habits were formed around the "Stay at Home" mandates implemented with COVID.  In 2021, sales are again falling into the long-term declining trends.  Most of the data in this post is based on 12-month averages to reduce short-term fluctuations and better define long-term trends. 

Chart I - Total Fluid Milk Sales

Chart II below expresses the annual changes as a percent.  As mentioned above, prior to COVID, fluid milk sales were averaging around a two percent annual decline.   In 2020 the decline slowed to near "0" and two months in 2020 even provided positive increases.  However, by 2021, a significant decline began again. While the decline is currently averaging around four percent annually, some of that can be attributed to the inflated numbers from the prior year.

Chart II - Milk Sales - Percent change from Prior year

As of October 2021, the pie chart below illustrates the split between whole milk, two percent fat milk, one percent fat milk, and fat free milk.  Whole milk and two percent fat milk are nearly the same size.  One percent fat and fat free milk are much smaller and declining faster.

Chart III - Current Milk Sales by Type of Milk

In the April 25, 2021 post to this blog entitled "The Amazing Success of Organic Milk," organic milk showed significant growth.  During the pandemic, the growth increased to new record highs, reaching a 12 percent increase over the prior year based on the 12-month average data.  It has recently started declining in 2021, but not as fast as conventional milk.

Chart IV - Organic Milk Sales

To put this in perspective, Chart V shows the comparison between conventional and organic milk.  Conventional milk sales have continued to decline, and organic milk sales show an increase over the span of this chart.  However, organic milk is still a niche product making up only six percent of total milk sales.  However, this is a half percent increase from early 2018 when organic milk made up about 5.4 percent of the total milk consumed.

Chart V - Conventional and Organic Milk Sales

Charts VI through IX show the growth by type of milk.  The charts for whole milk and two percent milk show the 2020 growth during the pandemic followed by a steep decline in 2021.  However, there is one big difference.  Whole milk, Chart VI, had been increasing in volume prior to the pandemic, but it is now falling below pre pandemic levels.  Two percent milk, Chart VII, appears to have returned to the pre pandemic declining levels. 

Chart VI - Whole Milk Sales

Chart VII - Two Percent Fat Milk Sales

One percent fat milk, Chart VIII, and fat free milk, Chart IX, show very little impact from the COVID pandemic.  Both continued their declines.  One percent milk is continuing a decline of nearly five percent annually and fat free milk is continuing at a near 10 percent annual decline.

Chart VIII - One Percent Fat Milk Sales
Char IX - Fat Free Milk Sales

Many people have been strongly wishing for a return to normal following COVID.  It appears that this is happening with fluid milk products.  The deep declines in 2021 are partially compensating for the increases in 2020.  The long-term trends of a two percent annual decline appear to be holding, with one percent and fat free milk taking major reductions.  

What will 2022 bring?  It appears that the percent declines in 2022 may be bigger than two percent as the impact of COVID mandates continue to decrease. The continuing trends will be followed in this blog.