Sunday, September 22, 2019

Butterfat Components Levels Continue to Rise. Now it's Time for Protein Improvement.

Milk protein prices have been low for the last five years.  During this time, butterfat prices have been consistently high.  Diary producers and their nutritionists have done an exceptional job of increasing butterfat levels in milk to record highs, increasing producer revenue.  The market is changing, and it is now time to put a strong emphasis behind increasing milk protein levels in milk.  In August, butterfat was worth $2.66/lb. and milk protein was worth $2.45/lb. and was quickly rising.

In the first fifteen years of the current milk pricing formulas, milk protein was consistently worth more than butterfat.  For the last five years that pattern reversed, as the butterfat price increased, and the milk protein price decreased.  This is changing in 2019 with a surge in milk protein pricing (see the circled area in Chart I).

Chart I - Milk Protein and Butterfat Prices
The milk protein price is driven by the 2019 change in cheese pricing - Chart II circled in red.  The change in the cheese price is driven primarily by a significant decline in cheddar cheese production resulting in lower cheddar cheese inventories.  Butter prices have remained stable and high, while cheese prices have increased by 36 percent YTD in 2019.

Chart II - Butter and Cheese NASS Prices
Table I below shows the butterfat component levels for 2017 and 2018 by Federal Milk Marketing Order (FMMO).  Butterfat levels which were once around 3.5 percent of producer milk, are now at 3.9 percent.  Increases in the Pacific Northwest have been amazing with a 2018 butterfat average over 4 percent.  California became a FMMO in November 2018 and the yearly average is based on two of the most productive months of the year.

Table I - Butterfat Levels in 2017 and 2018
Milk protein levels shown in Table II have increased too, but at a much slower pace.  Growth in butterfat increased .06 percent while milk protein increased .01 percent.  As will be covered in some of the charts later in the post, protein levels, which have risen slowly in 2018, seem to be rising faster in 2019.

Table II = Milk Protein Levels in 2017 and 2018
FMMO statistics are dominated by the Upper Midwest Order which had 23 percent of the total FMMO milk volume in 2018.  Charts III and IV show the butterfat and milk protein levels by year for the Upper Midwest Order.  Butterfat levels in 2018 show significant increases from the prior year.  For 2018, the average butterfat level was 3.92 percent.  

Protein levels shown in Chart IV increased very slightly in 2018.  Obviously, the emphasis has been on increasing butterfat levels shown in Chart III.  The slow growth of protein levels in producer milk has left an opportunity to increase revenue by increasing protein levels while maintaining or growing butterfat levels.  In the Upper Midwest Order, many producers are paid bonuses for higher protein levels.  Well over 80% of the milk in the Upper Midwest is used for cheese and higher protein levels are needed to efficiently make cheese.  This has created an obvious financial opportunity in the Upper Midwest by increasing producer revenue with higher protein levels.  In 2019 YTD it appears that attention is now being focused on improving milk protein levels.

Chart III - Upper Midwest Order Butterfat Levels
Chart IV - Upper Midwest Order Milk Protein Levels
The second largest FMMO is the Northeast Order with 19 percent of the total FMMO milk volume in 2018.  Charts V and VI show the changes in butterfat and milk protein levels in the Northeast Order.  The Northeast Order has lagged behind the Upper Midwest in 2018/19 component level growth.  Protein levels actually declined from the previous year in the Northeast Order in 2018.  Again, there is an opportunity to increase components and revenue with a higher level of both butterfat and milk protein.

Chart V - Northeast Order Butterfat Levels
Chart VI - Northeast Order Milk Protein Levels
The Pacific Northwest is a much smaller FMMO, with only six percent of the total FMMO milk volume in 2018.  The Pacific Northwest is included in this post because they have done an amazing job of increasing component levels.  

They have the highest butterfat levels of any FMMO and have continued to increase these levels regularly.  The Pacific Northwest also has the highest levels of milk protein of any FMMO and is also continuing to increase those levels significantly.

Chart VII - Pacific Northwest Order Butterfat Levels
Chart VIII - Pacific Northwest Order Protein Levels
From the data, it appears that the market forces are causing the right things to happen.  With higher prices, milk protein is on the increase at a faster rate in 2019 compared to prior years.  While there are various factors that can increase component levels, amino acid balancing is one of the proven and most consistent ways to increase butterfat and milk protein levels.  There are more and more experts in amino acid technology that can assist producers and their nutritionists in applying amino acid balancing science in nutrition.

In 2018, butterfat percentage increased from 3.82 percent in 2017 to 3.88 percent in 2018.  That means that the amount of butterfat in the same amount of milk increased by 1.5 percent.  The amount of milk per cow has increased by 1.4 percent per year for the last 20 years.  When these increases in components levels and milk per cow increases are compounded, the same number of cows will increase total butterfat volume by nearly three percent every year.  This is far above the needed milk supply.  Cow numbers have declined recently, but the decline is not enough.


Sunday, September 8, 2019

2018 Per Capita Consumption Data of Dairy Products is a Mixed Bag

August Class III milk prices, milk protein prices, and cheese prices were all up as predicted in the August 5, 2019 post to this blog.  History and the futures market suggest that these prices will remain positive for the remainder of 2019.

This post will examine the recently released data on domestic consumption of dairy products.  The data used in this USDA report is based on similar methodology used by the monthly milk sales report and the monthly milk disappearance report.

In total, the results reflect the following.

  1. Fluid milk consumption continues to fall at a rate slightly above two percent annually.
  2. Yogurt consumption continues to fall at a rate near two percent annually.
  3. Ice cream consumption is declining.  In 2018, consumption dropped over five percent.
  4. The rates of decline for fluid milk and yogurt appears to be slowly accelerating.
  5. Butter consumption is increasing near two percent annually.  Much of this growth is captured by imports butter led by imports of Irish butter.
  6. Cheese consumption is increasing at a rate of three percent annually, above the historical rate increase of two percent annually.
  7. With all products summed, the report shows a slight increase in the "fat equivalent" milk required to meet domestic consumption.  Butterfat production per cow is increasing above historical levels, meaning that fewer pounds of milk are needed for the equivalent amount of butterfat and because milk per cow continues to increase by above one percent per year, fewer cows are needed every year.
All charts below show annual changes on a per capita basis and on a total basis.  All data in this post reflect calendar year analytics for all years from 2000 through 2018.  

The change in total annual growth or decline of dairy consumption reflects the slowing growth in the U.S. population.  Chart I shows the percentage change by year in the U.S. population growth.   The population growth influences the amount of milk needed for production and consumption of dairy products.  In 2018, the population increased by just .6 percent.  Twenty years ago, the population was increasing by over one percent annually.  While the population is still growing, the growth rate is getting smaller.

Chart I - Annual Population Growth in the U.S.
Fluid milk consumption changes are shown in Charts II and III.  They reflect the same decline in milk consumption reported in the most recent post to this blog that contains data for the first half of 2019.   Fluid milk sales have been falling for decades and are currently falling much faster than previously in both per capita consumption and total consumption.  The current rate of total milk decline is slightly over two percent annually.

Chart II - Annual Percent Change in Per Capita Consumption of Fluid Milk
Chart III - Annual Percent Change in Total Consumption of Fluid Milk
Yogurt had positive but declining increases in consumption between 2000 and 2013.  Since 2013, yogurt consumption has been declining every year.  Charts IV and V show how yogurt consumption has decreased on both a per capita basis and a total basis.  The rate of decline is increasing and is currently around two percent shrinkage annually.

Chart IV - Annual Percent Change in Per Capita Consumption of Yogurt
Chart V - Annual Percent Change in Total Consumption of Yogurt
Ice Cream is also a declining category (Charts VI and VII).  Per capita consumption has been falling for decades and now total consumption is also declining.  Total ice cream consumption fell over five percent in 2018.

Chart VI - Annual Percent Change in Per Capita Consumption of Ice Cream
Chart V - Annual Percent Change in Total Consumption of Ice Cream
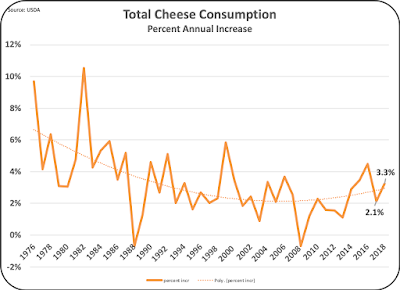
Cheese is the brightest spot in consumption of dairy products.  Charts VIII and IX show the growth of cheese on a per capita basis and a total consumption basis.  Cheese consumption had been growing at about a two percent annual rate, but for the last four years, that rate has increased to a three percent annual growth level.   There is price elasticity of demand for cheese, so lower prices for producer milk and therefore lower prices for cheese may be driving the increased growth.  If so, with higher producer milk prices, cheese prices will increase, and growth will likely return to the two percent level. 

Chart VIII - Annual Percent Change in Per Capita Consumption of Cheese
Chart IX - Annual Percent Change in Per Total Consumption of Cheese
Butter is another growth area for dairy (Charts X and XI).  Butter consumption is growing by about two percent.  However, as discussed in the August 15 post to this blog, a significant amount of this increased demand is being met with imported butter, especially Irish butter from Ireland.

Chart X - Annual Percent Change in Per Capita Consumption of Butter
Chart XI - Annual Percent Change in Total Consumption of Butter
SUMMARY


The USDA per capita consumption data summarizes the demand for milk based on a "fat equivalent" basis often known as "fat corrected" milk.  "Fat equivalent" is straight forward approach to summarizing the needed supply of milk.  The USDA data is based on the actual annual fat levels of producer milk, which in 2018 were at 3.9 percent of total milk. 

The percent change in the data is shown in Charts XII and XIII.  The charts show a long-term increase of over one percent annually and a 2018 total milk increase of about one percent.  That would indicate that some expansion in the milk supply is needed annually to meet consumption trends.  The 2018 increase in the needed milk supply is well above the prior year which was at .3 percent.  

The 2018 increase in the needed milk supply is clearly lead by the above current increases in cheese consumption.   A drop from the current annual growth rate of three percent in cheese consumption to historical levels of two percent would reduce the needed milk supply significantly.

Chart XII - Annual Percent Change in the Milk Supply Needed to Meet Consumption
Chart XIII - Annual Percent Change in the Milk Supply Needed to Meet Consumption
Cow productivity in pounds of milk per cow continues to grow at the historical rate of over one percent per year as covered in the July 25 post to this blog.  With the increased milk productivity per cow, there is no need for an annual increase in cows. 

Exports of dairy products appear to be stalled.   To reduce the still high inventories of cheese, the milk supply needs to be have negative growth for the short-term to bring cold storage inventories in line.