
The news is filled with comments and debates about free trade agreements. President Barack Obama is pushing congress to approve the Trans-Pacific Partnership (TPP) before his term in office expires. Hillary Clinton and Donald Trump are both opposed to the agreement. Donald Trump told the President of Mexico, Enrique Pena Nieto, that he wants to renegotiate the North American Free Trade Agreement (NAFTA). There are large public protests in Germany against the Transatlantic Trade and Investment Partnership (TTIP). Five countries, including the U.S. issued a joint letter to Canada objecting to its increased restrictions on dairy trade.
What impact do trade agreement have on the U.S. dairy industry? In 2014 U.S. dairy producers saw some of the highest dairy prices on record as dairy exports surged and global dairy prices skyrocketed. In 2015 and continuing into 2016, U.S. dairy prices have seen a reversal of exports and prices have fallen to lows. What is the impact of existing and new "free" trade agreements on exports and imports of U.S. dairy products? How does this impact U.S. dairy pricing?
All Free Trade Agreements attempt to level the playing field to allow global competition. Increased competition typically lowers prices for consumers. Some countries have advantages with lower labor rates, fewer environmental restrictions, few labor contracts, lower tax rates, and other factors. If all countries included in the pending new agreements were allowed to trade without duties, tariffs or quota restrictions, would the U.S. dairy industry benefit with increased demand or would prices collapse with the increased competition?
In reviewing other industries, trade agreements do tend to lower consumer prices with the increase in global competition, but some production typically leaves the U.S. and goes to other countries. Easily sighted examples are the automobile industry and the manufacturing of smart phones and other consumer products. In these cases, consumers have gotten the advantage of lower cost products, but much of the manufacturing has left the U.S.
Dairy once had shipping restrictions that forced a limited geographical range for production, processing, and sale of dairy products. The most important dairy product was fluid milk with 88% water and a shelf life that was limited to a few weeks. Today's market has shifted to dairy products with less water and a longer shelf life. Transportation of products has improved and costs have been reduced. Dependable refrigeration, where needed, is available throughout the distribution chain. With more global product standards set through the Codex Alimentarius, and set in trade agreements by the World Trade Organization (WTO), dairy ingredients and products are becoming standardized and commoditized. Both the Codex Alimentarius organization and the WTO are headquartered in Geneva, Switzerland. The U.S. is a member of both.
With global competition, additional volatility is introduced. Exchange rates vary, sometime drastically, changing the financial dynamics of the market place. Currently, the USD is very strong as the U.S. economy is healing faster than other global economies. A stronger currency makes U.S. produced dairy products more expensive and less able to compete in the global economy. World events like the Russian embargo on European dairy products adds supply to the world markets, reducing prices. Elimination of some dairy quotas in Europe has increased the global dairy supply and lowered international dairy prices.
There are also issues with product standards that can create competitive difficulties. The Somatic Cell Count (SCC) standard for the U.S. is a maximum of 750,000 cells per milliliter. The de facto standard for the rest of the world's dairy exporters is a maximum of 400,000 cells per milliliter. The mathematical processes are different and enforcement is different, however the higher U.S. value suggests a lower quality and puts U.S. dairy products at a competitive disadvantage in the international markets. Another example is the difference in the standards for skim milk powder and nonfat dry milk. Skimmed milk powder is defined globally by Codex Alimentarius whereby nonfat dry milk is defined by the FDA/FCR.
For more details on the impact of Free Trade Agreements refer to my recent article published in Progressive Dairyman. Future posts to this blog will focus on more detail on SCC differences and global vs. domestic dairy product standards. Dairy has changed from a regional business to a national business and is evolving quickly to an international business. The process may be slowed down, but it is doubtful that it can be stopped.
Sunday, September 18, 2016
Sunday, September 11, 2016
Imports and Exports - not much change
Updated data on dairy exports and imports became available during the first week in September. They show some variations, but generally follow the pattern of the prior 12 months. The value of U.S. exports began falling in 2014 and in mid 2015 reached a level near half of the 2014 high point. Since mid 2015, the value of dairy exports has remained relatively stable. U.S. prices for cheese and butter remain well above international values, which makes exports difficult.
New data also became available this week for U.S. production of cheese and butter. The charts in the prior post have been updated to reflect this. They do confirm high levels of production and combined with the low levels of exports, are increasing the inventories as reviewed in that post. Imports also remain at record levels.
Exchange rates continue to increase the difficulty of selling in the international markets. The New Zealand dollar has strengthened somewhat, but the Euro remains weak compared to the USD.
Cheese exports in July did show a slight improvement over June, but remain lower than the prior three years and are at the same level as the first six months of 2016.

Imports also continue to follow the prior six-month trends. These imports are coming from a variety of European countries and New Zealand.


Butter net exports remain at levels below the prior four years. Exports remain near zero and imports remain static. For more detail on butter pricing see the August 21, 2016 post to this blog.


The conclusions from all this data and other forecasts is that the international markets are not yet providing much relief that will improve prices and volumes of U.S. dairy exports. New Zealand appears to be reducing production and European production continues to decline. However, production must decline further to reduce the excesses.
The growth in U.S. inventories of cheese and butter are especially alarming. The high inventories will make price increases unlikely and lower prices probable. These inventories can only be brought in line by significantly lower prices on international sales or reduced production of cheese and butter. The global markets appear to be moving in the direction of bring supply in line with demand, but there needs to be further reductions. Excess inventories need to be deplenished before real and lasting pricing improvement can take place.
New data also became available this week for U.S. production of cheese and butter. The charts in the prior post have been updated to reflect this. They do confirm high levels of production and combined with the low levels of exports, are increasing the inventories as reviewed in that post. Imports also remain at record levels.
Exchange rates continue to increase the difficulty of selling in the international markets. The New Zealand dollar has strengthened somewhat, but the Euro remains weak compared to the USD.
Cheese exports in July did show a slight improvement over June, but remain lower than the prior three years and are at the same level as the first six months of 2016.

Imports also continue to follow the prior six-month trends. These imports are coming from a variety of European countries and New Zealand.

The combination of exports and imports show a slowly improving trend in net exports. However, the numbers are still far below 2014 levels.


Other dairy commodities that are used in calculating producer prices include NDM and Dry Whey. There is little change in the exports and imports of these products, so no new charts are shown.
Exchange rates continue to have an impact on dairy exports and imports. The USD/Euro exchange rates remain largely unchanged as the European economy continues to struggle. However, there is some significant strengthening in the NZD. This is putting extreme pressure on New Zealand producers as their oversupply continues to struggle to find a home at profitable prices. New Zealand is extremely dependent on exports, as approximately 80% of the production must find a home in the international markets.


The growth in U.S. inventories of cheese and butter are especially alarming. The high inventories will make price increases unlikely and lower prices probable. These inventories can only be brought in line by significantly lower prices on international sales or reduced production of cheese and butter. The global markets appear to be moving in the direction of bring supply in line with demand, but there needs to be further reductions. Excess inventories need to be deplenished before real and lasting pricing improvement can take place.
Monday, September 5, 2016
Prices Generally Up - Will it last?
On August 31, August Class III Milk and Component Prices were released. Prices were up, except for butter and butterfat which were just slightly down. The Class III price was $16.91/cwt., the highest price since November 2014.

Milk protein showed a tremendous increase of 34.7% due to the increase in cheese prices and lower butter price.
The pie chart of the component makeup of the milk check is shown below. In July, milk protein made up just 37% of the milk check. In August, this increased to 46% and further increases in the value of milk protein can be expected as global butter markets equalize with U.S. butter prices declining .

In the last month, there have been numerous new articles on reduced milk production in Oceania and the U.S. Additionally the USDA announced a program to buy excess cheese and reduce inventories. While this news is positive and has brought higher prices in August, will these prices hold and perhaps continue to increase? As forecast by the futures market, Class III milk prices will linger in the $16/cwt. area, which is above 2015 and 2016 YTD price, but well below the 2014 highs of $24/cwt.
CHEESE
The most important parameter for milk prices is the price of cheese. The price of cheese is strongly influenced by the cheese inventory levels. Unfortunately, cheese production continues to increase and cheese inventories, as shown below, continue to build.
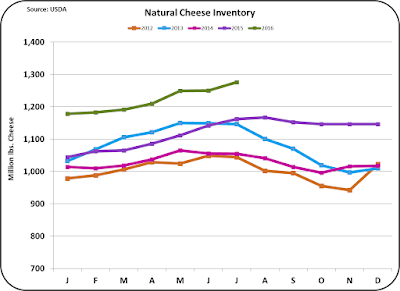
The USDA purchase of cheese as announced was for the purchase of 11 million pounds of cheese. The excess between inventories at this time last year and the current level is about 110 million pounds of cheese. That means that the USDA purchase of cheese is about 10% of the "excess" inventory. The reality is that the purchase provides only a small dent in the excess inventories. That really leaves the increase in cheese price (up 10.4%) as largely an emotional response, not based in firm analytics.
Production of cheese remains robust. The current level of production does not seem to recognize the decreased exports and increased imports of cheese. The best rationale for the continued high production is that cheese does represent a good parking spot for excess milk production.


New export and import data will soon be available and will be reviewed in the next post to this blog.
BUTTER
Butter pricing was covered in some detail in the prior post. The price of butter did fall slightly in August to $2.23/lb. This is still a high price for butter, well above $2/lb. and well above international prices.

Butter production has increased slightly during 2016.

The increased churning combined with almost no exports and significant imports is causing butter inventories to increase to record levels. A continuation of this will cause further decreases in the butter price.

As mentioned in the prior post, international butter prices remain well below U.S. prices and will, in the long-term, cause a further decrease in the U.S. butter price. While this will not cause a significant drop in the Class III milk price, it will shift the financial emphasis from butterfat production to milk protein production.
NONFAT DRY MILK / SKIMMED MILK POWDER
Because NDM/SMP prices are set internationally, and because there is still a glut of NDM/SMP available globally, prices remain low. The EU, New Zealand, and the U.S. are financially competing for sales. In the June, exports from each were about equal. Both New Zealand and EU are dealing with decreased demand. New Zealand has strongly felt the downturn of SMP sales to China. The EU is dealing with decreased SMP purchases in the war torn Mid-East. Also, the EU has excess milk and has been using SMP as a way to store excess milk production. The growth in EU SMP production and the decrease is export sales has resulted in bloated inventories and low prices as the EU seeks new export sales.

There is currently little hope for short-term change to eliminate these NDM/SMP inventory excesses and low prices. NDM futures pricing shows only a slight increase to low $1/lb. pricing in 2017. This will not significantly impact Class III milk prices.
CONCLUSION
While there is much good news of indicators that will improve producer milk prices, the changes have been too small to make dramatic increases. August prices were refreshing, and show enough strength to increase milk prices from their lows, but until more changes occur, there is little chance of a major change.
The next post will cover U.S. exports and imports. The data will be available soon. In late September a review of the international markets and the impact of free trade agreements will also be addressed in this blog.

Milk protein showed a tremendous increase of 34.7% due to the increase in cheese prices and lower butter price.
The pie chart of the component makeup of the milk check is shown below. In July, milk protein made up just 37% of the milk check. In August, this increased to 46% and further increases in the value of milk protein can be expected as global butter markets equalize with U.S. butter prices declining .

In the last month, there have been numerous new articles on reduced milk production in Oceania and the U.S. Additionally the USDA announced a program to buy excess cheese and reduce inventories. While this news is positive and has brought higher prices in August, will these prices hold and perhaps continue to increase? As forecast by the futures market, Class III milk prices will linger in the $16/cwt. area, which is above 2015 and 2016 YTD price, but well below the 2014 highs of $24/cwt.
CHEESE
The most important parameter for milk prices is the price of cheese. The price of cheese is strongly influenced by the cheese inventory levels. Unfortunately, cheese production continues to increase and cheese inventories, as shown below, continue to build.

The USDA purchase of cheese as announced was for the purchase of 11 million pounds of cheese. The excess between inventories at this time last year and the current level is about 110 million pounds of cheese. That means that the USDA purchase of cheese is about 10% of the "excess" inventory. The reality is that the purchase provides only a small dent in the excess inventories. That really leaves the increase in cheese price (up 10.4%) as largely an emotional response, not based in firm analytics.
Production of cheese remains robust. The current level of production does not seem to recognize the decreased exports and increased imports of cheese. The best rationale for the continued high production is that cheese does represent a good parking spot for excess milk production.

The August NASS price for cheese was $1.81/lb. The futures prices through 2017 are now reflecting prices more in the $1.70/lb. area.

BUTTER
Butter pricing was covered in some detail in the prior post. The price of butter did fall slightly in August to $2.23/lb. This is still a high price for butter, well above $2/lb. and well above international prices.

Butter production has increased slightly during 2016.

The increased churning combined with almost no exports and significant imports is causing butter inventories to increase to record levels. A continuation of this will cause further decreases in the butter price.

As mentioned in the prior post, international butter prices remain well below U.S. prices and will, in the long-term, cause a further decrease in the U.S. butter price. While this will not cause a significant drop in the Class III milk price, it will shift the financial emphasis from butterfat production to milk protein production.
NONFAT DRY MILK / SKIMMED MILK POWDER
Because NDM/SMP prices are set internationally, and because there is still a glut of NDM/SMP available globally, prices remain low. The EU, New Zealand, and the U.S. are financially competing for sales. In the June, exports from each were about equal. Both New Zealand and EU are dealing with decreased demand. New Zealand has strongly felt the downturn of SMP sales to China. The EU is dealing with decreased SMP purchases in the war torn Mid-East. Also, the EU has excess milk and has been using SMP as a way to store excess milk production. The growth in EU SMP production and the decrease is export sales has resulted in bloated inventories and low prices as the EU seeks new export sales.

There is currently little hope for short-term change to eliminate these NDM/SMP inventory excesses and low prices. NDM futures pricing shows only a slight increase to low $1/lb. pricing in 2017. This will not significantly impact Class III milk prices.
CONCLUSION
While there is much good news of indicators that will improve producer milk prices, the changes have been too small to make dramatic increases. August prices were refreshing, and show enough strength to increase milk prices from their lows, but until more changes occur, there is little chance of a major change.
The next post will cover U.S. exports and imports. The data will be available soon. In late September a review of the international markets and the impact of free trade agreements will also be addressed in this blog.
Subscribe to:
Posts (Atom)