Sunday, September 23, 2018

The Milk Supply Grows and Grows

The USDA released August data on milk production on September 19, 2018.  The data shows a continuing increase in the milk supply.  Cow numbers have shown little change in the last two months. The August data shows a 1.4% increase in the milk supply in August and a 1.3% increase YTD in 2018 (Chart I).  As covered in the June 27 blog post, the milk supply growth is well above the growth in consumption.  Even with low producer milk prices, the milk supply continues to grow.

Chart I - Milk Production through August - 23 States
The decline in domestic fluid milk consumption is signaling a growth rate well below the increase in the milk supply.  The May 28, 2018 post showed a declining rate of fluid milk consumption of 3.3%.  The decline now appears to be accelerating.

Florida is a good indicator of fluid milk consumption changes, as almost all of Florida's milk is for fluid consumption. Because fluid milk cannot be held for a long time, it is impossible to build an inventory of fluid milk.  What is produced is consumed quickly.

For years Florida's milk was the highest paid milk in the country because Class I milk for drinking is the highest paid milk and Florida's milk is almost all Class I milk.  Now Florida has to contend with a rapidly shrinking market for their milk. The milk produced in Florida (Chart II) has been declining at an increasingly fast rate topped by August's decline of 7.8% vs. the prior year.

Chart II - Florida Milk Production Decline January to August 2018
The drop in fluid milk consumption in Florida has also caused a drop in the cow numbers as shown in Chart III.  The most recent change in cow numbers is -4% vs. the prior year.

Chart III - Florida Cow Decline January to August 2018

States other than Florida are less influenced by the declining consumption in beverage milk.  
Milk volumes going to growth products like cheese temper other states decline in beverage milk.  As an example, the Upper Midwest milk goes mostly to cheese, so it is minimally impacted by the decline in fluid milk consumption.  The milk supply in Wisconsin is up 1.4% in August over the prior year, which is slightly below the current growth rate for cheese consumption.

What states are growing in milk production?  Texas, Kansas, and Colorado are growing in milk production.  Texas is now the fifth largest dairy state.  Its milk production has grown by 12% since the start of 2017.  In August Texas produced 1.1 billion pounds of milk.  If the growth rate continues, they could pass New York and Idaho to become the third largest milk producing state in the U.S. behind only California and Wisconsin.

States with shrinking milk production in August include Virginia at -4.3%, Vermont, at -3%California at -2.3%, Michigan at -1.3%, New Mexico at -0.8%, Pennsylvania at-0.7%, Illinois at -0.6%, Oregon at -0.5%, and Ohio at -.02%.  Most all of these states have a significant amount of declining fluid milk in their portfolios.

The overall message on where the dairy industry is going is getting increasingly clear.  Class I beverage milk is declining and the trend appears to be accelerating.  Because Class I is the highest paid milk, the overall average price (the "uniform" price) will also decline.  This, in-turn, will have implications on the producer price differentials, which will also decline and that may lead to further de-pooling.

There is still too much milk in the system and that is being channeled to cheese because it can be inventoried for a longer period of time.  The high cheese inventories will keep the cheese price low and therefore the Class III milk price will remain low.

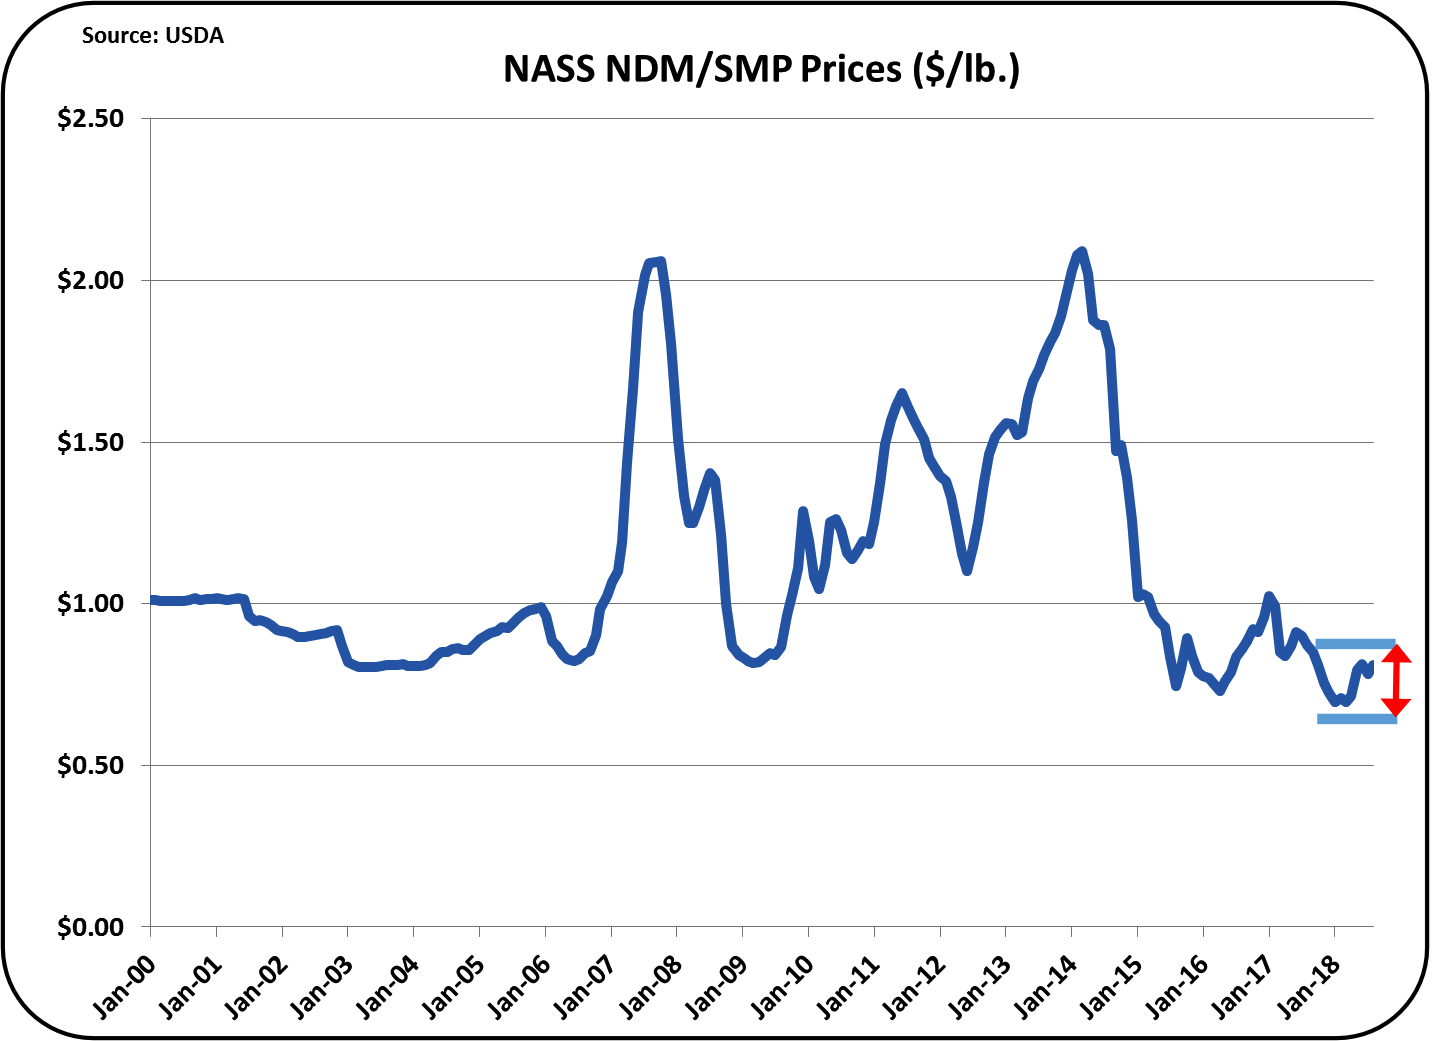
Although butter was not specifically covered in this post, the continued increase in the consumption of butter will also lead to excess nonfat dry milk/skimmed milk powder, keeping Class IV milk prices low.  Overall, it appears that milk prices will remain "status quo."

Thursday, September 13, 2018

What's Wrong With These Charts?

New production, inventory, and export data is now available.  Warning - some of these charts may be offensive!

As covered in prior posts, the linkage between the cheese price and the Class III milk price is firm.  As goes cheese, so goes Class III milk.  If the price of butter goes up, that can be good for producers only if they can produce more butterfat than they used to.  The price of butter has very little influence on the Class III price, which uses standardized component levels.

The charts below show how out-of-balance production, inventories, exports are for cheese, butter, and nonfat dry milk.

Cheese production is way above any normal growth pattern for consumer and export demand (Chart I).

Chart I - Cheese Production
Cheese inventories are running extremely high (Chart II).  The very high inventories have been building for almost two years.  The inventories are well above what is needed for the normal demand growth, which is shown via the chart trend line.

Chart II - Cheese Inventory
Exports of cheese (Chart III) are not showing any growth at all.  While there is lots of hype about increasing exports, when it comes to cheese, there is no growth in exports.

Chart III - Cheese Exports
Is cheese a good place to hide excess milk production?   It can be held for a while, but the end result is high inventories and low prices.  While there is news in the press about the impact of Mexican tariffs on cheese, what we are looking at is a long-term issue, not something that just happened in the last few months.

Predictably, the price of cheese is low and getting lower.

Chart IV - Cheese Prices
When we look at nonfat dry milk/skimmed milk powder (NDM/SMP), the pictures are a little different, but show some of the same patterns.  The charts again show production well above the normal growth line.  This is probably caused by the demand for butter.  Excess NDM/SMP is more of a by-product than a co-product.

Chart V - NDM/SMP Production
When we look at stocks of NDM/SMP, it is very easy to see levels well above the norms.

Chart VI - NDM/SMP Inventory
The export chart for NDM/SMP showed great growth for three months, but since April 2018, the exports levels have fallen.  Did the earlier 2018 exports just shift the excess stocks to another country and now those must be reduced?  If so, we may see a leveling of the year over year exports of NDM/SMP.

Chart VII - NDM/SMP Exports
Putting the NDM/SMP pieces together, results in the very predictable pattern of low prices.  The current prices are the lowest in the 19 years shown in Chart VIII.

Chart VIII - NDM/SMP Prices
Butter analytics have a strange but very different profile.  Butter domestic consumption is growing at a current rate of 2.6% per year.  But production is not growing at all.  Chart IX below shows no growth in the last seven years.

Chart IX - Butter Production
In spite of consumer growth in butter consumption, inventories are currently at or below the levels of the prior two years.

Chart X - Butter Inventory
Exports of butter are growing.  YTD in the first half of 2017, 2.7% of butter production was exported.  That has risen to 4.5% in 2018, a dramatic increase.  But at 4.5% butter exports have the lowest export rate of any major dairy export item.  What is being exported is going mostly to Canada with a significant volume also being exported to Mexico.

Chart XI - Butter Exports
The range of prices for butter has narrowed, but they have stayed above $2/lb. which is the average for the last four years.  Tight inventories always result in high prices.

Chart XII - Butter Prices
In summary, we have too much cheese, too much NDM/SMP, and not enough butter. These inventories in turn result in low Class III milk prices, low milk protein prices, and high butterfat prices. 

The mix of too much NDM/SMP and too little butter is certainly a contrarian problem that will continue.  Both products come from the same Class IV milk and you can't have one without the other.  That may currently be limiting butter churning. 

The over supply of cheese is probably being forced by the oversupply of milk.  The supply of milk is not dropping, but sooner or later, it will have to drop.  Once it drops, inventories will begin to drop and only then will the Class III milk price improve.