U.S. milk production is not growing. In the past, growth of 1 to 2 percent was required to supply demand, especially for the increasing consumption of cheese. Now almost no increase in milk production is needed.
For reference, the largest milk producing states are listed below. The numbers are based on 2023 YTD data. Idaho retains third place over Texas with strong growth starting in mid 2022.
 |
Million Pounds of Milk
July YTD 2023 |
Chart I below shows the change in milk production over the last five years. Milk production started slowing in mid 2021. The monthly range, high to low, since then has been less than 1%. Chart I is based on 12-month moving averages to reduce monthly volatility. The U.S. is now growing the milk supply by less than .5% annually
 |
Chart I - U.S. Milk Production From the
Start of 2019 to the Most Current Data Available. |
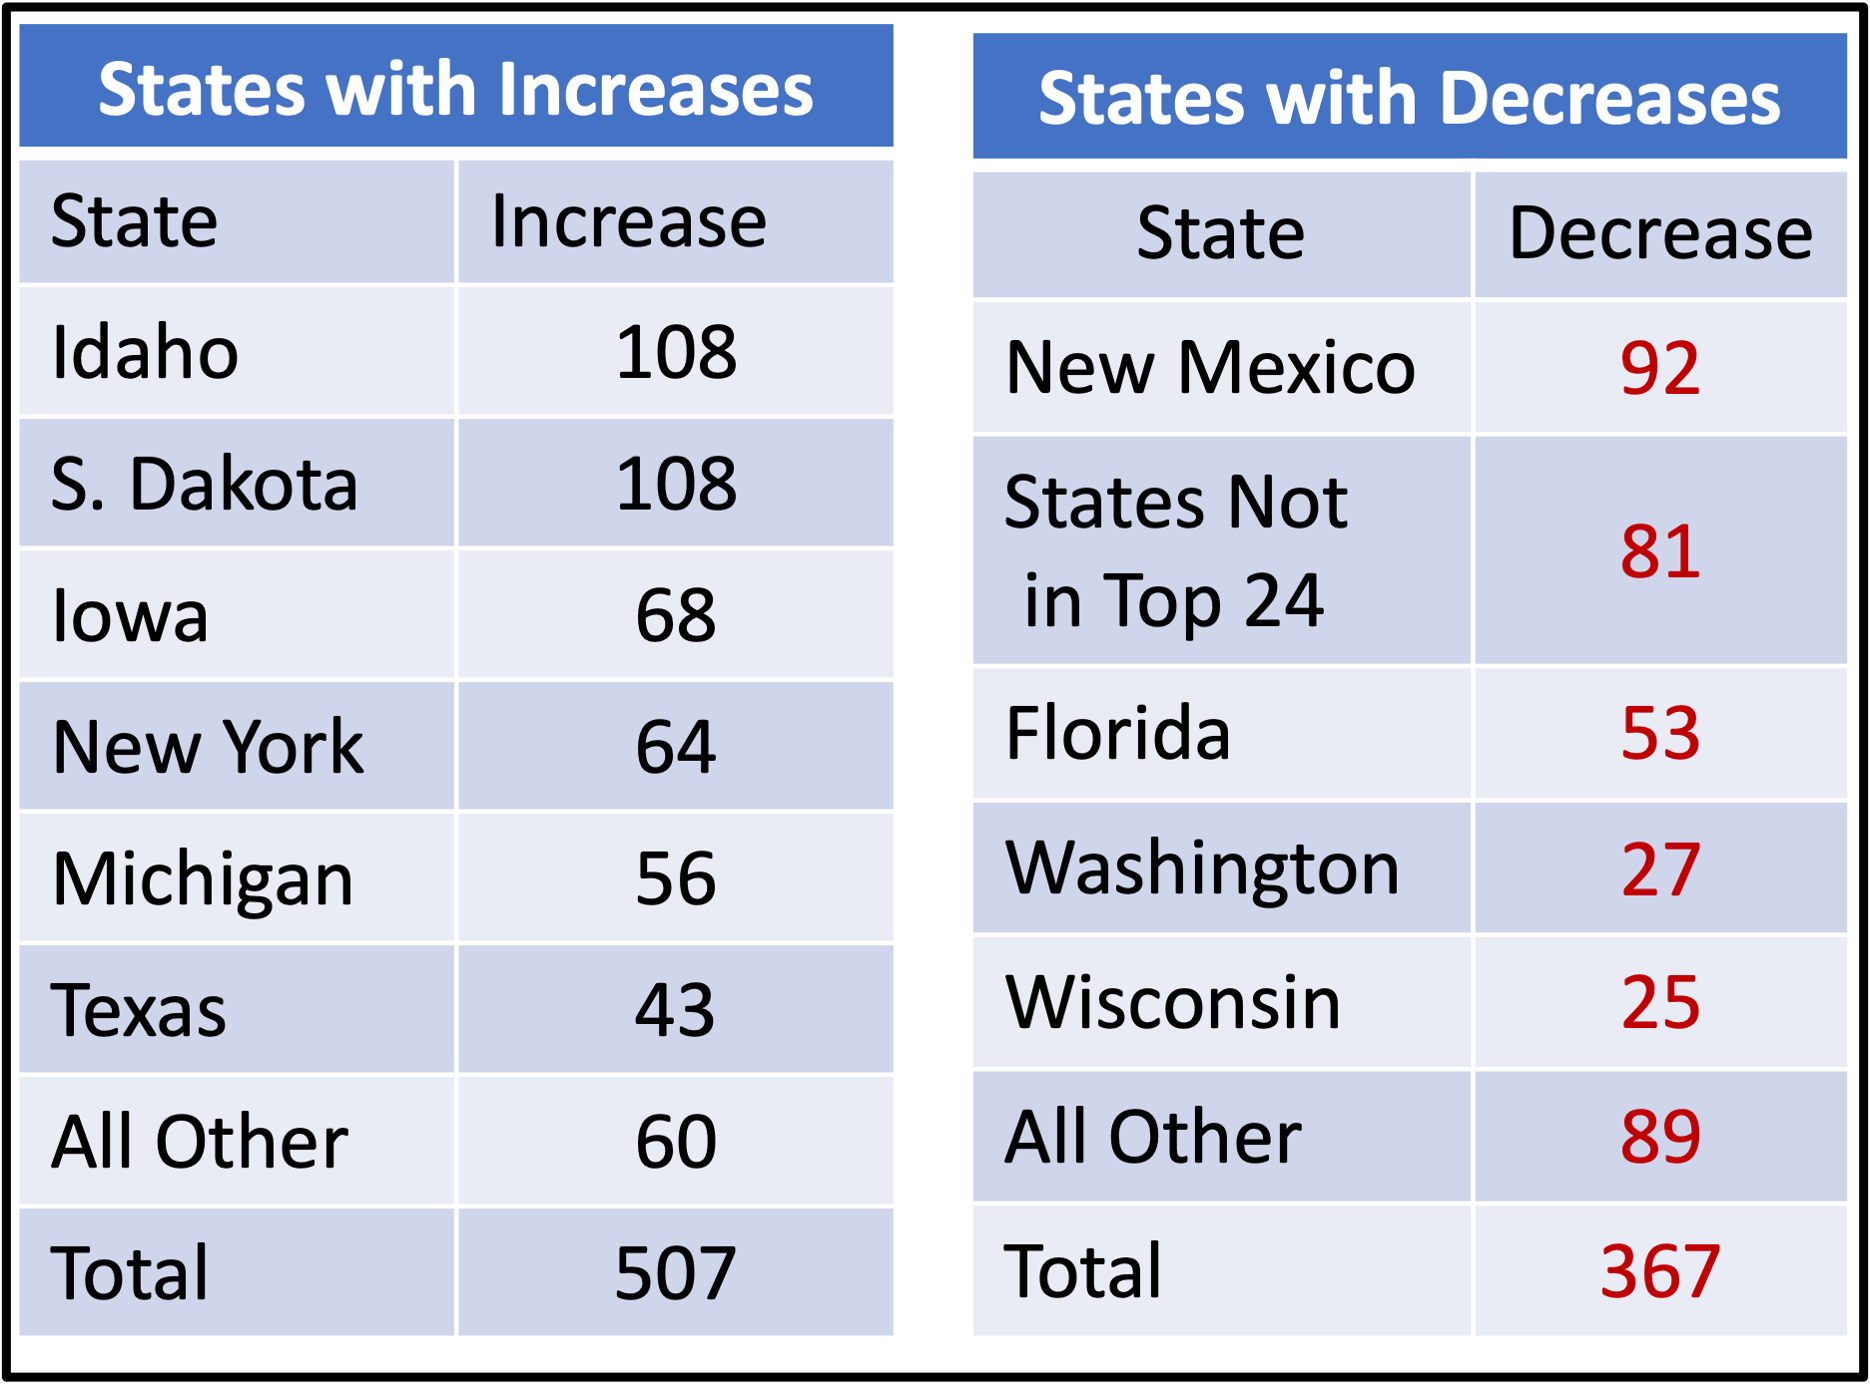
What states have been impacted the most? Below are tables listing the states that have gained in milk production and those that have lost milk production. Comparing 2023 to 2022 YTD, there was an increase of 666 million pounds of milk, which is an increase of just under .5% compared to the prior year.
States with the largest Increases and Decreases
in Milk Production - Million Pounds - July 2023 YTD
Dairy cow counts have decreased since peaking in May of 2021. The decline is about 1%. The increased milk produced per cow has been able to keep the milk supply stable with fewer cows.
 |
Chart II - U.S. Dairy Cows From the
Start of 2019 to the Most Current Data Available. |
Cow numbers did increase slightly comparing 2022 and 2023 YTD July. California which had by far the largest decrease in milk production has reduced almost no cows. Florida did reduce their cow herds by 53,000 cows.
States with Increases and Decreases
in Cows (000)
What is causing the change to almost no annual increase in milk production? The decrease can be coming from competition from plant based "milk," and/or from lower exports, and/or from lower domestic consumption. The following items will be covered in upcoming blogs.
In the
March 12, 2023 post to this blog, the FDA's draft to allow plant based "milk" to be branded as milk was covered. Some grocery outlets are now mixing plant based and dairy based products in the milk section. The nutritional differences seem to be ignored on the grocery shelf. Fluid diary milk consumption has been falling for years and the decline may be accelerating.
The year 2023 has been tough on exports. It is difficult to find a good price for international sales of nonfat dry milk. More data on this will be forthcoming in a future blog. New Zealand has a huge export market and has established brand names for different locations, different languages, and different customers. Should a program like that be developed for the U.S.?
Domestic cheese consumption, which is the largest use of milk, has been growing at about 2% annually. Where is cheese consumption now? Does it need more marketing? Countries like France and Italy have a much higher per capita consumption rate for cheese. Is there something there that can be implemented in the U.S.?


Typo on your top chart, Michigan is on there twice, the first one I assume is Wisconsin :)
ReplyDeleteCorrected - Thanks
Delete