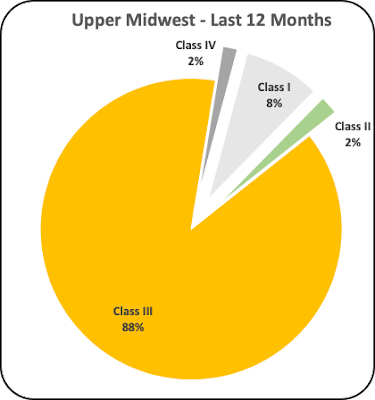
The May 2009, post to this blog covered de-pooling in the Upper Midwest. A lot has changed in 13 years. Charts I and II below show the comparison of 2009 and 2022 (the last 12 months ending in September 2022). The Upper Midwest is still primarily a Class III milk for cheese Federal Order. However, the swings in Class I milk and de-pooling are huge.
Class I milk cannot be de-pooled, but all other milk can be de-pooled from the Order.
 |
| Chart I - Pooled Milk Marketed in the Upper Midwest in 2009 |
By 2022 (Chart II), 47 billion pounds of milk were produced, and 19 billion pounds of milk were de-pooled. Class I made up only eight percent of the pooled milk or just five percent of the total milk produced. Class III milk made up 88 percent of the pooled milk.
 |
| Chart II - Pooled Milk Marketed in the Upper Midwest in the most recent 12 months |
 |
| Chart III - Pooled and De-pooled Milk in the Upper Midwest |
 |
| Chart IV - Pooled and De-pooled Milk in the Upper Midwest. |
The current payment system was developed in the late 1900s and implemented January 2000. At that time Class I milk was the largest category of milk and the system was designed to keep Class I milk priced above the other classes. With less high-priced Class I milk, the Uniform price will be lower.
Chart V shows the percent of Class I milk in the Upper Midwest Federal Order. It is well known that consumption of fluid milk is declining. From 2005 to 2022 the percent of Class I milk in Upper Midwest declined very significantly from an average of 17 percent to just 5 percent. The decrease is a result of two factors, less Class I milk is being produced and more Class III milk for cheese is being produced. It is a trend that is long-term, and it will continue and therefore, its impact on lowering the Uniform price is definite and will continue.
 |
| Chart V - Upper Midwest Percent of Class I Milk (Includes Pooled and De-pooled Milk) |
 |
| Chart VI - The Upper Midwest PPD |
WHAT DOES THIS MEAN TO DAIRY PRODUCERS?
What happens to producer prices when there is de-pooling. De-pooling does not create more funds for producers. It only shifts the money around. A simulation was made using data from January 2021. There was a lot of Class III de-pooling in that month. The PPD for the pooled milk was a negative -$.92 per cwt. Those that de-pooled were paid more because they could avoid the negative PPD. If the total volume of milk was pooled, assuming that those that de-pooled milk were paid at Federal Order rates, the negative PPD would be much lower. If all the milk was pooled, the PPD would have been a negative -$.21 per cwt.
By de-pooling, the additional money that moved to the pockets of those that de-pooled amounted to over $7 million in one month. Those that remained in the pool, paid the $7 million due to the high negative PPD of -$.92 per cwt.


No comments:
Post a Comment