Component levels in producer milk have been slowly but steadily increasing for years. Now, the growth in component levels is growing much faster. Technology to increase component levels is available and improving. Producers and nutritionists are implementing these practices at an accelerating rate. The data used in this analysis is for pooled Class III milk.
Chart I covers the years from 2018 through August of 2021 with data based on 12-month moving averages. During this time, butterfat levels have increased from 3.81 percent to 3.96 percent. Butterfat prices were at historically high levels in 2018 and 2019, starting at $2.61 per pound, but have fallen to more normal levels and are currently at $1.75 per pound. Butterfat percentage set a record in the Southwest Federal Order in February 2021 at 4.25%.
 |
| Chart I - Butterfat Percentage and Prices |
Chart II presents the same data for milk protein. Milk protein levels have experienced a bumpy ride, but protein levels are now increasing very fast. The growth in 2021 compared to 2020 is from 3.18 percent to 3.20 percent. The price of milk protein has also been a bumpy road. Over the span from 2018 to August 2021, the 12-month average price has increased from $1.83 per pound to $3.21 per pound. The highest monthly percent for milk protein was also achieved by the Southwest Federal Order at 3.38 percent in January 2021.
 |
| Chart II - Milk Protein Percentage and Prices |
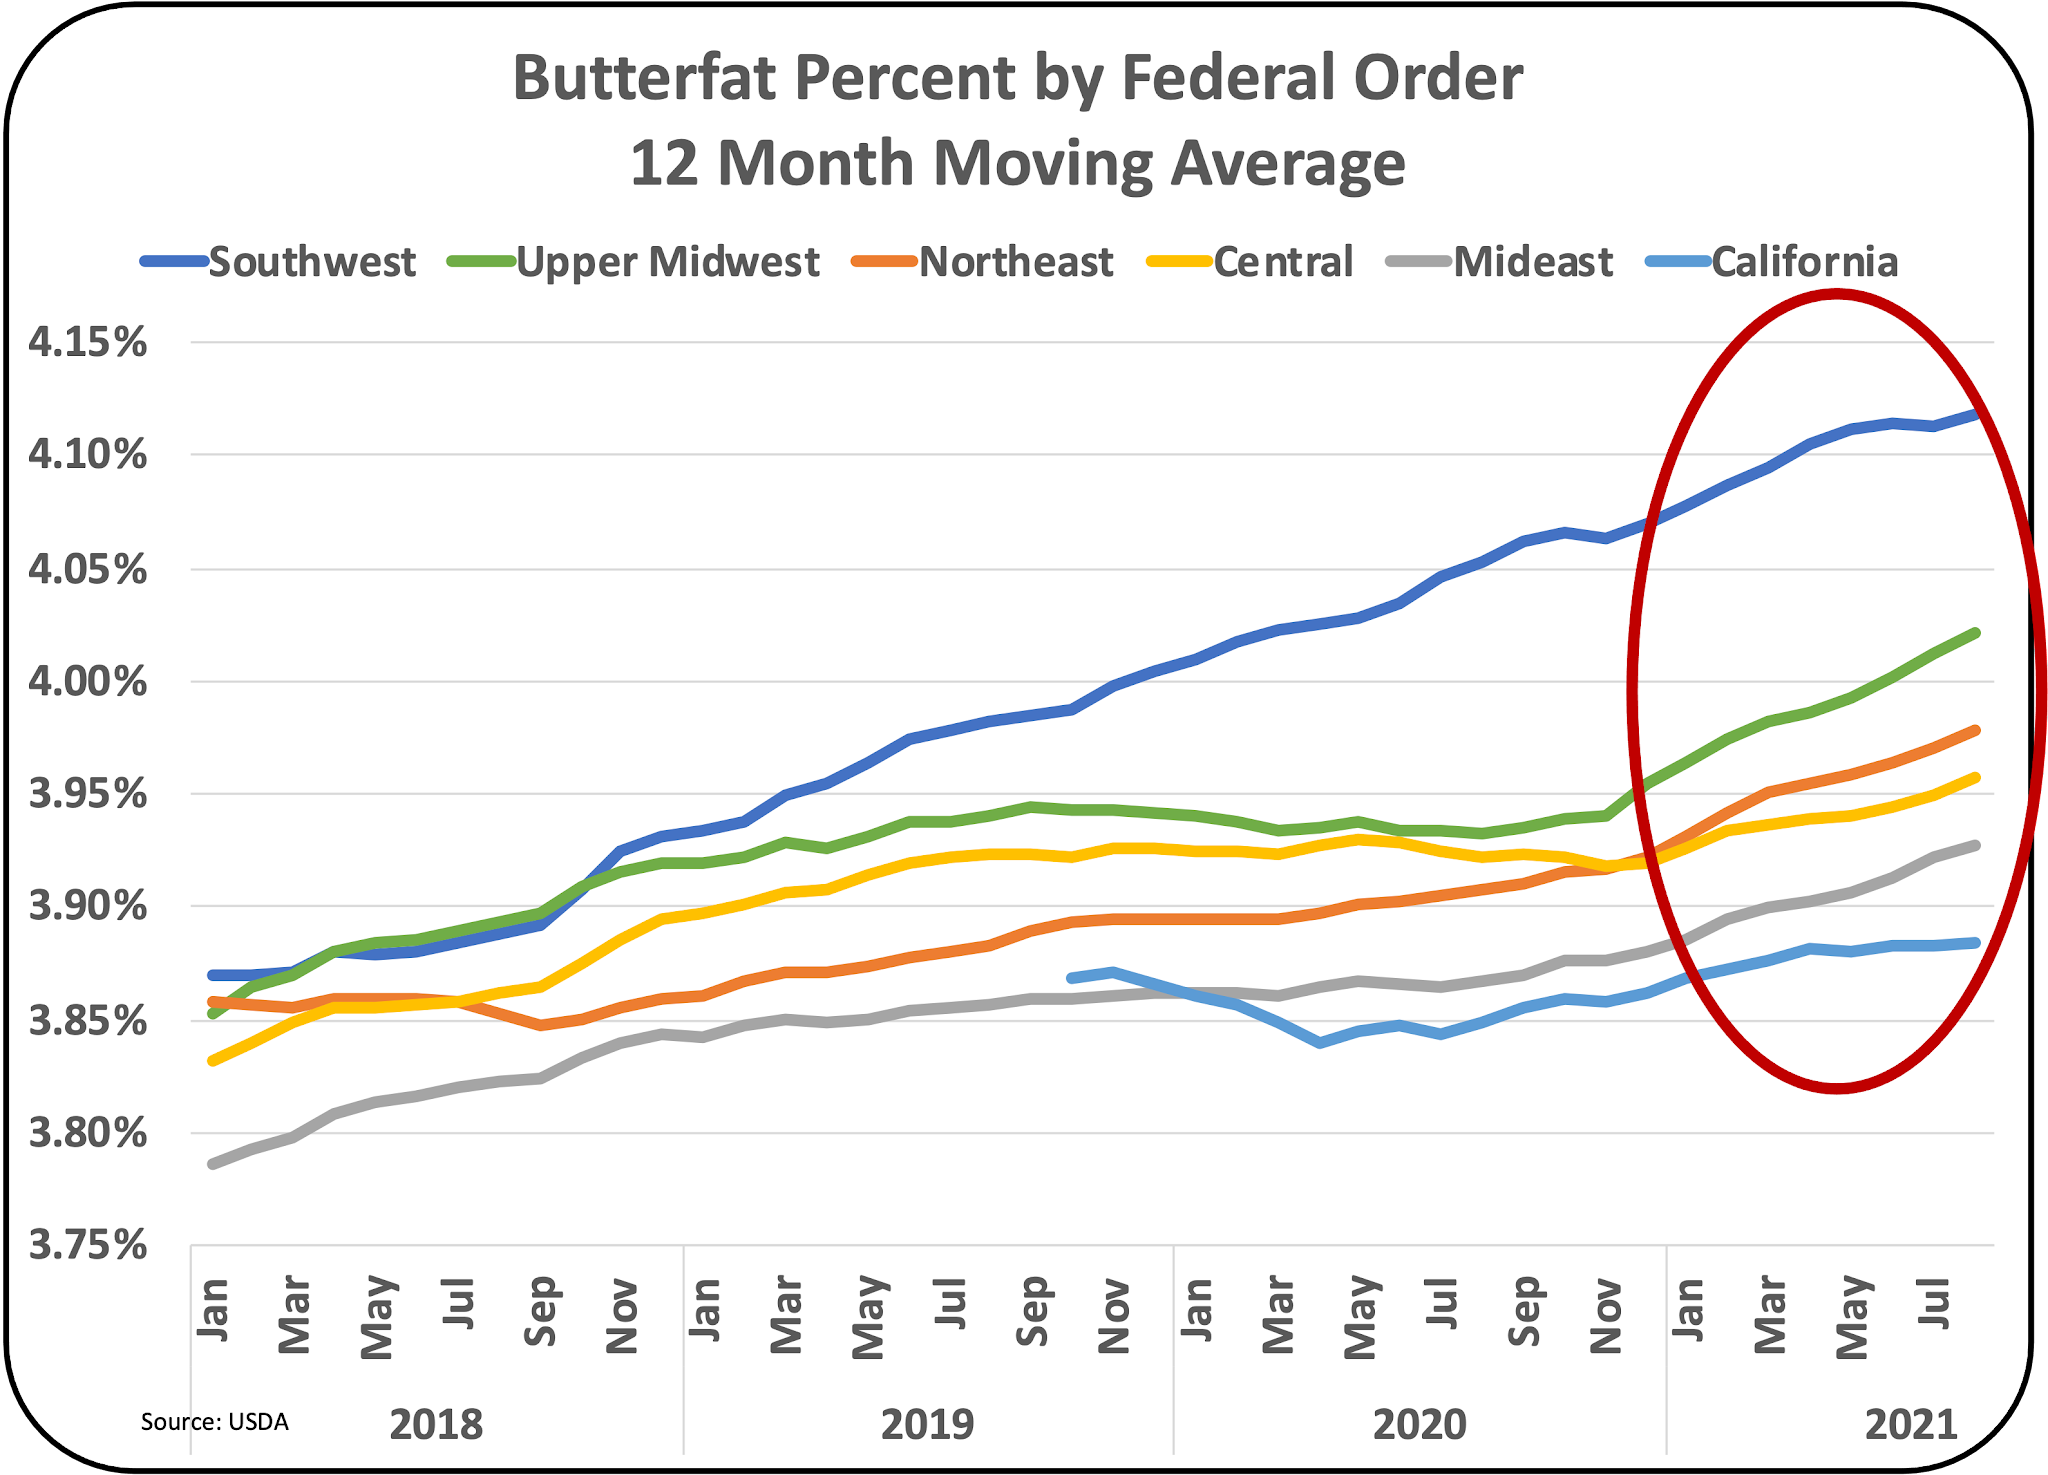
Individual Federal Orders show major differences (Chart III). The Southwest Federal Order has increased butterfat levels steadily from 2018 to the present and is clearly the leader in butterfat levels with a 12-month average currently at 4.12 percent. The other five Federal Orders have all significantly increased butterfat levels in 2021, setting record levels for their individual Orders.
 |
| Chart III - Butterfat Percentages by Federal Order, |
The growth in 2021 can be clearly seen in Table I below. The numbers in Table I are the eight-month averages for 2020 and 2021. The Upper Midwest Order is increasing butterfat percentage faster than any other order. For the first eight months of 2021 compared to the first eight months of 2020, the upper Midwest butterfat averages increased by .10 percent. The Southwest, Northeast, Mideast and Central Federal Orders also had very nice increases ranging from .06 percent to .08 percent.
The four Federal Orders paid by the Advanced system had the lowest butterfat levels and the smallest increases in butterfat levels. All Federal Orders get paid for butterfat. Those Federal Orders having the lowest levels of butterfat have an opportunity to increase butterfat and revenue with proven practices.
 |
| Table I - Growth of Butterfat Percent by Federal Order. |
Milk protein for the seven Federal Orders paid for butterfat, milk protein, and other solids is shown graphically in Chart IV. The Pacific Northwest has had the highest protein levels for years, but it has now slipped to second place behind the Southwest. The second to the lowest protein levels are in the Upper Midwest, where most of the milk is used for cheese and there is vast de-pooling.
 |
| Chart IV - Protein Percentages by Federal Order |
Table II displays the milk protein levels for 2020 and 2021 by Federal Order. The Southwest, California, and Northeast Federal orders have improved protein by .05% in 2021 over the prior year. The Mideast, Central, and the Pacific NW increased protein by slightly less.
Amazingly, the Upper Midwest where nearly 90 percent of the milk is used for cheese which needs high protein levels for efficient production has the lowest protein percentage and the lowest increase in protein levels, comparing 2021 to 2020. This is an opportunity for producers in the Upper Midwest.
 |
| Table II - Growth of Protein Percentage by Federal Order |
SUMMARY
The Southwest, which was ranked highest in the
recent post on "Where are the Cows Going?" again comes out at the top of the analysis in this blog post. The Southwest is a model for other Federal Orders.
The Upper Midwest is at the top of the charts in percent growth of butterfat, but it is at the bottom of the charts for protein. This seems very strange for a Federal Order primarily supplying cheese plants and creates another great opportunity. Balanced feeds to increase milk protean also generally increase butterfat.
The lack of butterfat in the Orders paid by the Advanced system is also an opportunity for producers to increase butterfat. They are paid for each pound of butterfat, and making more butterfat increases revenue.
Overall, the 2021 increases are record setting and demonstrate the potential for increasing components and revenue. As an example, a producer with one thousand cows producing 80 pounds of milk per cow per day who increased component levels at the averages in the Tables I and II, would increase revenue by $68,000 a year.


No comments:
Post a Comment