Sunday, July 17, 2022

What's Happening in California? Does California need a Federal Order?

California became a Federal Milk Marketing Order in November 2018.  California is the largest dairy state, but it is also very different from other U.S. locations.  Under the California milk payment system used prior to November 2018, no milk could be de-pooled.  With the Federal Order, all but Class I milk for drinking can be de-pooled.  Under the California system, milk protein was not paid for specifically, but under the Federal Order system, milk protein is paid for specifically, which should financially stimulate efforts to increase milk protein.  ALL the milk processed by the California Federal Order is paid for butterfat, milk protein, and other solids at the Federal Order rates.

California's agricultural system makes certain feed items available and plentiful, but that also makes dairy diets very different from the diets used in most of the U.S.

The mix of milk uses is also very different as California is the largest butter producing state, supplying about one third of the U.S. butter.  That makes the California Class IV milk a much larger piece of the milk market than other parts of the U.S.  Traditionally Class IV milk is the lowest priced of the four milk Classes.

The four Federal Orders in the middle of the U.S. pay a premium for low somatic cell accounts.  When California asked to become a Federal Order, they did not request this provision.  While the value added for low somatic cell counts is relatively small, it is still producer revenue paid elsewhere but not paid in California.

To top the list of "different" things in California, there is the adjustment for owning or not owning "Quota."  Quota was developed a long time ago to reward those producers that produced just enough milk to meet the demand.  If they produced more than what was needed, they were paid less.  Over time buying the limited amount of "quota" created value for the quota owners.  The USDA did not want to take responsibility for this when California became a Federal Order, so the state of California manages this. Those without Quota must pay into the pool so those that own Quota can receive a payment.  There have been many efforts to phase out Quota, but it still exists.  Nothing like this exists in any other Federal Order, and as a result California producers who do not own Quota have lower revenue than other Federal Orders.

Class I milk is decreasing very fast in California.  During the three years that California has been a part of the FMMO system, Class I milk for drinking decreased by 17 percent (Chart I).  The rate of decrease is slowing down, but the volume lost does impact producer milk prices.  Class I milk is intended to be the highest paid Class of milk.  Because all producers in a Federal Order are paid based on the averages of the four milk classes, when the highest paid milk shrinks in volume, the average price drops.
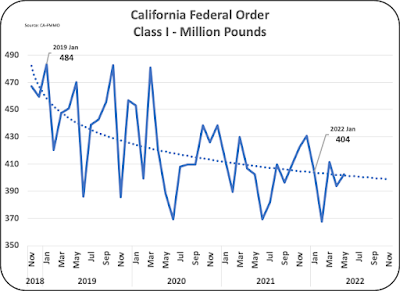
Chart I - Class I Milk Paid Through the FMMO

Class II milk for products like ice cream and yogurt is designed to be the second most valuable Class of milk.  The volume of Class II milk is small compared to the other Classes.  Unfortunately, the volume of Class II milk (Chart II) in the California Federal Order is also falling.

Chart II - Class II Milk Paid through the FMMO

Another big factor is de-pooling, which allows producer milk other than Class I to be removed from the Federal Order payment system at will.  Chart III shows the volatility of Class III milk for cheese and Class IV, milk for butter.  The de-pooling started immediately once California became a Federal Order.  Since California became a Federal Order, two thirds of Class III milk has been de-pooled and one fourth of Class IV milk has been de-pooled.  When Class III milk is de-pooled, as much as 99.9 percent is de-pooled.  Of the three Classes of milk that can be de-pooled, nearly half the milk production in California has been regularly de-pooled (removed) from the California Federal Order.
                               
Chart III - Classes III and IV Milk Paid through the FMMO

The best way to estimate where Class III milk is going in California is to follow the amount of cheese production.  Chart IV indicates that cheese production in California is falling and, therefore, Class III milk volume is falling.  The March to May 2022 period showed a nice increase in cheese production, but it its too early to see if this increase will be maintained,

Chart IV - California cheese Production Since
Becoming a Federal Order

In the first half of 2022, with estimated de-pooled milk included, Class III & IV make up 85 Percent of the milk marketed in California (Chart V).

Chart V
When 85 percent of the milk is heavily de-pooled and, therefore, not subject to Federal Order pricing or regulations, do they need the overhead of a Federal Order organization for Classes III and IV?  

Class I milk is decreasing in volume and as of 2022  makes up only 12 percent of the California milk.  Class I milk is intended to be the highest priced milk.  A part of that is the "Class I Differential."  What is a Class I differential?  Why does it exist?

Historically, Class I milk for drinking was the largest milk category and important to the health of U.S. citizens.  Because the cows did not live in cities where the people who drink milk live, a system was developed to assure proper payment for supplying milk for drinking to the people in cities.

Historically, fluid milk processing plants were typically located in a city.  The milk producer had to deliver the milk to that plant where it was bottled and typically delivered to homes by small deliver trucks and grocery stores.  The cost to get the milk to the city was covered by the miles from the county where the cows were to the "pool plant" where the milk was received.  That helped ensure that the city populous of the U.S. could receive milk in sufficient quantity and at reasonable prices.  The prices in the Class I differential have not been updated since 2008, and realistically the whole Class I Differential model is way out of date from the realities of today's processors and consumers.

The base price of Class I fluid milk is based on the average of Class III and IV milk plus $.74 per cwt.  Class III is for cheese and Class IV is for butter.  What does this have to do with the price of Class I drinking milk?  Again, the model is out of date.

So that really drives the question of why is California a Federal Milk Order?  Does the cost of maintaining a Federal Order really create value?  The Western Milk Marketing Order was disbanded in 2004, and has remained to be a robust milk producing area.  Idaho that was in the Western Order is today the third largest milk producing state.

Comments are welcome.  The next post will expand some of these thoughts to the entire United States.


Sunday, July 3, 2022

Butter Up - Cheese Down

Butter and butterfat prices are at record levels approaching $3.00 per pound.  Cheese prices are high but are not a record and have started to decline.  Many of the prior posts to this blog have covered various aspects that influence the current high prices and how long they will last. The prior posts that can provide additional detail are listed below.

PRICES

Butter prices have continued to reach record highs.  Production of butter is down and domestic consumption and exports, are up.  The price of butter has now reached $2.92 per pound.  The price of cheese is down four percent from the prior month and will probably fall further.  Cheese is currently at $2.33 per pound. Charts I and II show the changes in the prices for butter and cheese since the beginning of 2017.

When the price of butter goes up, the price of butterfat goes up and the price of milk protein goes down.  When the cheese prices go up, the price of milk protein goes up.

Chart I - The AMS Price of Butter

Chart II - The AMS Price of Cheese

INVENTORIES

The driving force behind these prices is the wholesale inventories of butter (Chart III) and cheese (Chart IV and V).

Butter inventories continue to decline compared to the two prior years.  Butter inventories have a strong seasonal swing.  However, as of May 2022 they are currently even with the months of May between 2017 and 2019 as shown by the red line on Chart III.  During the 2017 to 2019 period butter was valued at about $2.25 per pound.  Currently, wholesale butter prices are about 50 cents per pound higher than in 2017 to 2919 (Chart I above).

When butter inventories were higher (2020 and 2021), butter prices were lower.  Now inventory levels are back to the 2017 to 2019 levels, but the price is much higher.  Is this temporary or is there additional need with higher inventories to support higher exports and domestic consumption?

Chart III - Butter Inventories

Total cheese inventories continue to climb providing an overall inventory level consistent with consumption and exports.  in May 2022 cheese inventories increased four percent compared to the prior year.  These inventories represent a normal inventory of total cheese.  There is no shortage that would cause cheese price increases.

Chart IV - Total Cheese Inventory

The Agricultural Marketing Service (AWS) bases the price of "cheese" on the price of young cheddar cheese.  Inventories of cheddar are not publicly available, but 70 percent of American cheese is cheddar, so the inventory of American cheese (Chart V below) is a good indicator of the inventory of cheddar cheese.  (See Chart V in the May 15 post to this blog.)

The inventory of American cheese is at a level which matches the long-term growth of exports and domestic consumption.

Chart V - Inventory of American Cheese

PRODUCTION

Production of butter continues to decline (Chart VI).  The decline is often blamed on a lack of milk, but as shown in Chart III, the current level of butter inventory is at the levels of 2017 to 2019 when butter prices were high but not this high.  Is some or all of the decline in butter production really just adjusting to meet an adequate level of inventory?  Are the higher retail prices, caused by the high wholesale prices, dampening consumer demand?

Chart VI - Production of Butter

Production of all cheese continues a consistent pattern through May 2022 (Chart VII).  Compared to the prior year, cheese production is growing at about three percent annually.

Chart VII - Production of All Cheeses

Production of American cheese has flattened (Chart VIII).  This represents a 70/30 percent mix of cheddar and other American cheeses.

Chart VIII - Production of American Cheese

Production of cheddar cheese has declined while the production all other American cheeses have hit record production levels in April and May.  In March through May 2022 cheddar production dropped below the normal trends. In April, production of cheddar did not decrease.  This may be the start of a turnaround to bring cheddar production back to normal levels allowing recovery of inventory levels.  That is consistent with the drop in price of the AMS price of cheese in June (Chart II).  Data for production is not yet available for June. 

Chart IX - Production of Cheddar Cheese

SUMMARY

Cheese does not seem to have a production or inventory problem.  The mix of cheese production has favored cheeses other than cheddar.  This creates a very temporary increase in cheese pricing. It is likely that balance will soon be restored to cheddar versus other cheeses and prices will decline.  They have already started to decline.

Butter is a little more confusing.  Exports have doubled, production is down, and inventories have returned to levels prior to COVID.  There may also be a drop in domestic consumptions as retail prices have nearly doubled.  The most likely scenario is that butter and butterfat will remain at high prices in the near term.

Wholesale butter and cheese are commodities.  Commodities prices tend to find normal levels over time.  Butter will likely take longer to drop in price than cheese.  

In the short term, butterfat prices will likely remain high and protein prices will migrate lower.  This will lower the Class III milk price (See the May 22, 2022 post to this blog).