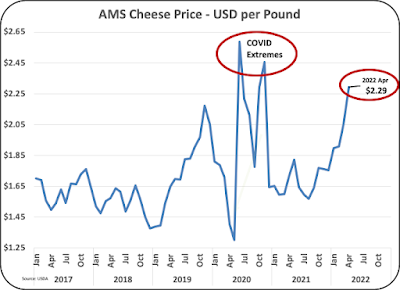
The prior post covered the financial shifts of butter prices, the reasons behind them, and the impact on producer milk prices. This post will cover the more complicated financial shifts of cheese prices. Chart I shows the price of cheese beginning with 2017. During the COVID lockdown, cheese prices were extremely volatile with some major highs and lows. Those fluctuations were caused by the disruption between food service and retail sales of cheese. The current high Agricultural Marketing Service (AMS) cheese price of $2.29 per pound is a near record ignoring the extreme fluctuations that occurred in 2020.
The survey data for the AMS cheese price is more complicated than the price of butter. Butter is butter with few significant differences. There are many different types of cheese with varying values. The USDA process for developing a price for cheese was implemented in 2020 and relies on surveys of only one type of cheese, newly produced Cheddar cheese.Before getting into some of financial aspects, the charts below quantify cheese production by the major types of cheese. As shown in Chart I, Cheddar cheese makes up just 29 percent of total cheese production. The price of newly manufactured Cheddar becomes the AMS cheese price used to calculate milk protein and producer milk prices. No other cheeses are considered in establishing the AMS cheese price.
 |
| Chart II - Pie of the two leading Cheeses and All Other |
USDA cheese analytics characterize cheese as "American" or "All Other." The American cheese category includes Cheddar cheese as well as other cheeses like Colby and Jack cheeses. The "American Cheeses" represent 41 percent of all cheese production (Chart III). The "All Other" category includes Italian and other non "American Cheeses." Mozzarella cheese is by far the largest "All Other" cheese.
 |
| Chart III - Pie of American and All Other Cheese |
 |
| Chart IV - Pie of American Cheeses |
Chart V compares the price of cheese to the wholesale inventory of all cheeses. The prior post compared the inventory of butter to the price of butter. There was a clear and consistent correlation; as the inventories of butter were lower, prices were higher. There is not a clear correlation between total cheese inventories and the AMS calculated price of cheese (Chart V).
 |
| Chart V - Total Cheese Inventories and AMS Price of Cheese 12-Month Moving Averages |
There is a clearer correlation when comparing the inventory of "American Cheese" to the AMS calculated price of cheese (Chart VI). Remember that Cheddar cheese makes up 72 percent of "American Cheese."
 |
| Charr VI - American Cheese Inventories and AMS Price of Cheese 12-Month Moving Averages |
Cheddar cheese production has an average growth rate of just over two percent per year. The growth rate was consistent between mid 2019 through the end of 2021. The first quarter data for 2022 shows no growth in production Cheddar cheese (Chart VI).
 |
| Chart VI - Cheddar Production 12-Month Moving Averages |
The long-term growth of "American Cheese" is very consistent for total "American Cheese", Cheddar cheese, and all other American cheeses as shown in Chart VII.
 |
| Chart VII - Production of Total American Cheese, Cheddar Cheese, and All Other American Cheese |
"American Cheese" production has shifted in 2022 from Cheddar to other "American Cheeses." Overall, in the first quarter of 2022, production of all other "American Cheese" grew by eight percent over the prior year while production of Cheddar shrank by two percent. Therefore, inventories of Cheddar cheese have undoubtedly shrunk while inventories of other American cheeses have grown.
 |
| Chart VIII - Percent Production of American Cheese Which is Cheddar Cheese |
The conclusion from this is that the current high AMS cheese prices are linked to the lower production of Cheddar This lower production of Cheddar will lower Cheddar inventories. This is not based on lower milk availability or some other long-term issue, but just a shift from Cheddar production to all other "American Cheeses." This will not last long as production must come into sync with demand. Expect Cheddar production and inventories to increase and the AMS price of cheese to decrease in the short-term. This is a different conclusion from the prior post on butter, which will likely experience continued increases in the AMS price of butter.
The next post to this blog will compared how the price of producer butterfat and milk protein change with changes in butter and cheese prices. Remember, that when butter prices go up, butterfat prices go up and milk protein prices go down.


Hi John, excellent write-up and analysis as usual. Questions: regarding butterfat, do you know or have access to stats on butterfat used in cheese, and cultured products vs. milk consumed? Also, is NDM relatively stable or growing over time? Just thinking it doesn't make sense that with declining fat from fluid, butter production was able to grow so much 2017-2020 unless the fat was coming from milk used for other diary products.
ReplyDeleteThank you again for putting the effort into producing these excellent and informative blog posts.
Excellent questions - Yogurt seems to have new life after COVID and a lot of it is nonfat. That should add to butterfat availability, but it is a small category. Ice cream is again declining and should leave more butterfat available. Again, it is a small category.
DeleteI will have to research the average butterfat in cheese. I do believe that some cheese processors are removing some butterfat to reach their proper ratio instead of adding protein. That makes economic sense.
None of this really answers the shortage of butter.
NDM typically grows as butter churning grows.