

Cheese now utilizes over 50% of the U.S. milk produced. Cheese and other dairy items need only components, not milk volume. Fluid milk continues to decrease in consumption. Butterfat is at record high prices, and milk protein is at decent prices. Are these prices just temporary? What can a producer do to deliver milk that meets the current needs and provides adequate revenue? This post will quantify the financial impact of changes in component pounds and prices over the last 23 years. It appears that the increase in component prices and the increase in component levels are not a short term events.
The October 15 post showed the monthly component level changes over the last six years including the first 10 months of 2023. Chart I below illustrates the annual butterfat percent from 2000 to 2022. The increase in average butterfat levels is dramatic. Today's cows are producing 10% more butterfat in their milk on the average. That is the average, many are producing at much higher butterfat levels.
The increase in butterfat levels began in 2011 and has not stopped.
 |
| Chart I - Annual Butterfat Percent |
The same is true of milk protein levels which are up 7% over this same time period as displayed in Chart II below. Protein levels were increasing in the first 10 years of Chart II, and in 2011 began increasing at an accelerated rate.
 |
| Chart II - Annual Protein Percent |
Charts I and II are the averages for all Federal Order dairy cows. Every producer is paid for butterfat. In seven of the Federal Orders the producers are also paid for the pounds of milk protein. Many producers are maximizing revenue by using the proven tools to successfully increase butterfat, protein, and revenue.
Further boosting revenue is the increase in milk per cow (Chart III). Over the time span used in this post, milk per cow has increased by over 30%. With that increase in milk comes higher quantities of components.
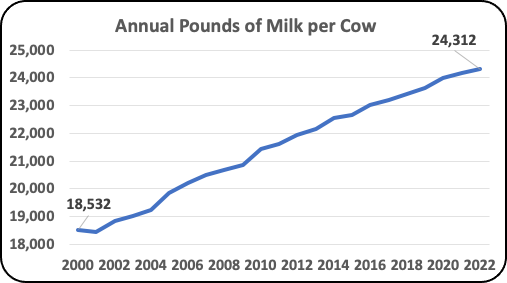 |
| Chart III - U.S. Annual Milk Production per Cow |
 |
| Chart IV - Average Annual Price of Butterfat and Milk Protein |
 |
| Chart V - Revenue per Cow for Butterfat and Milk Protein |
 |
| Chart VI - Combined Revenue per Cow for Butterfat and Milk Protein |
Is the increase in milk/cow attributed to larger cows? Or are cows able to produce an increase in volume at relatively the same size a decade or two ago?
ReplyDeleteThey are based on the cows that exist in each year.
Deleteare these dollar graphs adjust for inflation?
ReplyDeleteI could do that based on retail inflation percent per year. Please contact me if you are interested. johngeuss@gmail.com
DeleteThe inflation rate over from 2000 to the present is about 70%.
DeleteNo
ReplyDelete