Wednesday, April 29, 2009

Where are Class III prices going?

On May 1, the new Class III milk component prices will be announced. Where are they headed?
Let's review the underlying data that influences the pricing.

Protein pricing is calculated from this equation.

Protein Price = ((Cheese price – 0.2003) x 1.383) + ((((Cheese price – 0.2003) x 1.572) – Butterfat price x 0.9) x 1.17)

This can be simplified as follows:

Protein Price = 3.22 x Cheese Price - 1.28 x Butter Price - $.43

Similarly, Butterfat pricing is calculated from this equation.

Butterfat Price = (Butter price – 0.1715) x 1.211

This can be simplified as follows:

Butterfat Price = 1.21 x Butter price – $0.21

The actual calculation uses the National Agricultural Statistical Services (NASS) cheese and butter prices which lag the Chicago Mercantile Exchange (CME) prices by about two weeks (April 2 post to this blog). However, we'll look at the CME prices as they are made available on a timelier basis.

First, butter prices


Butter prices are clearly up, so we can expect an improvement in butterfat pricing.


Where are cheese and protein prices going?


Cheese prices have taken a downward tumble. With Cheese prices down and butter prices up, we can expect protein to be down for April.

For Class III milk pricing the simplified formula (April 7 post) is as follows:

Class III Milk Price = 9.6 x Cheese Price + 5.9 x Dry Whey Price + 0.4 x Butter Price - $3.20

Cheese prices are down and dominate the Class III formulas, so there is no doubt that Class III will be down for April. Not good news.

Monday's post will review the actual Class III prices that will be announced on Friday and their impact on the long term trends.

What does the USDA forecast for 2009? Even posting it is painful!


Sunday, April 26, 2009

CWT Program is out of Sync with the Times

Cooperative Working Together (CWT) is working hard to try to improve the low milk pay situation by altering the supply and demand factors. In this post, we'll examine their programs to see what might be expected.

Because this post is largely critical of the CWT efforts, a copy of this blog is being forwarded to their office in case they would like to add comments expressing their differing opinions.

In many of the earlier posts (April 7 & 23 posts), we discussed the relationship between cheese prices and milk prices. The relationship is very tight.


We've also demonstrated that the cheese price is primarily linked to imports which are heavily influenced by exchange rates (April 13 post).


The current policy of CWT is to influence the U.S. milk supply through herd retirements. They are, for now, abandoning their efforts to influence exports. Quoting from the CWT website, "the export program will not be utilized in 2009". By the way, New Zealand's leading dairy publication is "Dairy Exporter".

It certainly appears that the CWT has missed the real issues in two ways:

  1. Can they really have a lasting influence on milk supply through herd retirements? When there are profits in the U.S. dairy industry, cow numbers will increase. When there are no profits, cow numbers will decline. Any external attempt to artificially alter this relationship will have a very short term influence.


  2. Herd retirements do not address the real issue of milk pricing volatility - imports of commodity cheeses. The key here is global cheese supply and currency rate fluctuations. A temporary decline in the number of cows in the U.S. has a negligible impact on the real factors at work globally. CWT has failed to recognize that the real threat to the U.S. dairy industry is global, not domestic. (If we want to spend money on herd retirements, the money should be used to retire herds in New Zealand, not the U.S.!)

While there are serious issues on milk pricing in the U.S., the current CWT effort - which was developed by some very knowledgeable people sure seems to not address the real issues. Producers need every cent to survive the current situation. It is not a time to waste any desperately needed funds.


Let's see if there is a rebuttal. I encourage CWT to post a comment refuting these facts.

Thursday, April 23, 2009

Is Milk Pricing Really Tied to Cheese Prices?

In the April 7 post, the mathematical equations for calculation of Class III milk prices were discussed. The fundamental equations for Class III pricing come down to the following:

Class III Milk Price = 9.6 x Cheese Price + 5.9 x Dry Whey Price + 0.4 x Butter Price - $3.20

That means that when Cheese prices move, there is a 9.6x impact on the Class III price. However, when butter prices move there is only a .4x impact. While the dry whey price has a 5.9x impact, the value of whey is small enough that the impact is minimal. The whey supply is obviously tied to cheese production, but the demand side can be very different.

I've had a few comments on this questioning whether cheese prices can really have this big an impact on a dairy producer's economic health, so I've developed a few charts to substantiate this relationship.

The first chart shows the correlation between cheese prices and the Class III milk price. I have used the National Agricultural Statistical Service (NASS) market survey price for cheese, not the Chicago Mercantile Exchange (CME) cheese pricing (see April 2 post).


The correlation is almost 100%. This is in spite of changes in the "make allowance" for cheese over this period of time. The 98% correlation means that 98% of the change in Class III milk prices can be predicted by changes in the cheese price - a very strong correlation?

The chart below goes one step further and tests the correlation between all Federal Milk Marketing Order (FMMO) milk prices and the NASS cheese price. This FMMO pricing includes those orders paying on skim and butterfat and well as the component pricing orders which dominate the FMMOs.


Again, the correlation is very strong. This is partly because the component payment milk orders are such a large part of the overall FMMO's milk volume.

Numbers don't lie. Cheese prices really control the financial health of the U.S. dairy industry.

More on this in upcoming posts

Monday, April 20, 2009

Long Term Trends

The long term trends for Class III butterfat and protein prices indicate an upward trend for protein and a steady level for butterfat. There is good reason for these trends and good reasons for the short term drops.


Lets examine the long term consumption trends for fluid milk, butter and cheese in the U.S. over the last century - yes 100 years of data.


Fluid milk has had a very long term downward trend in consumption. We can be critical of the trend, we can rationalize the trend, but it is real and there is a very high probability that it will continue.


Butter consumption dropped by 75% until the mid 70's. Since then it has been steady. So has the price of butterfat.

Cheese consumption is steadily going the other way.


Cheese consumption has been increasing for years and there is no reason to think it won't continue (April 9 blog post). Cheese cannot be made without protein. Does it bear a resemblance to the chart above on protein price? It should and it does.

These trends significantly impact the dairy industry. When fluid milk was "King", our dairy industry econimics were dominated by domestic economic factors. Fluid milk has a limited shelf life and was expensive to transport due to the high volume of water.

Now that cheese is becoming "King", the dairy financial picture shifts drastically. Because cheese has a much longer shelf life and has up to 10 times the value of milk on a per lb. basis, the global dairy economy comes into play. Dairy economics are now impacted by global supply and demand and fluctuations in currency rates.

Poultry, beef, soybeans and many other food and agricultural markets have had to live with the influence of global supply and demand changes and currency fluctuations for years. Now dairy can join the list of industries subject to the ups and downs of global influences.

How will the dairy industry cope? Will the industry have to emphasize the use of tools like future markets and exchange rate hedging? More to come on this in future posts.

Thursday, April 16, 2009

Cheese Exports and Imports - Country by Country

In the last post (April 13), we looked at the volatility of cheese exports and imports. This time, we'll review exports and imports country by country.

Exports first


The largest U.S. customer for cheese is clearly Mexico. Mexico's demand for cheese has risen at a steady rate through 2008 - almost no volatility. The only significant decline was Egypt and the volumes were small. There is no really big volatility in export volumes. In the first two months of 2009, cheese exports were higher than any year except 2008.

Imports

The country by county statistics on cheese imports are shown below in two graphs. The first chart shows the major export countries and the second chart shows only those that had dramatic changes.


Imports from the European countries remained relatively stable. The imports from the European countries are primarily "specialty" cheeses with type or brand identification, not easily subject to substitution.


However when we look at the major non-European country's cheese imports, the volatility comes into focus. These represent primarily "commodity" cheeses which are easily subject to substitution.


New Zealand is in a class by its self. The change in New Zealand imports is huge and dramatic. Argentina and Australia also saw a major changes in volume and the combined impact of all three shown in this chart has a major impact on demand for U.S. produced cheese.

What can be concluded?

  1. In the April 7 post, the correlation between Class III milk pricing and cheese prices was established.


  2. In the April 13 post, volatility in demand for U.S. Cheese was linked to changes in export/import volumes, not U.S. consumer demand. The volatility in export/import volumes was linked to changes in exchange rates for the U.S. dollar.


  3. In this post the export/import swings were identified to be primarily influenced by import fluctuations. The "drill down" of imports country by country showed that imports of "commodity" cheeses from New Zealand, Argentina and Australia create the import volatility.

What does the future look like considering the above?


The longer term outlook will be discussed in a future post to this blog.


Your comments are appreciated.

Monday, April 13, 2009

Cheese Exports & Imports Impact Prices

In the April 9 post, the U.S. domestic consumption of cheese was analyzed. It did not show any significant changes from historical trends. Domestic cheese consumption is steady and predictable and does not contribute to price volatility.

In this post, the imports and exports of cheese are analyzed and the volatility starts to show. First the Exports:


Through much of 2008, the U.S. dollar (USD) was weak and exports were at the highest levels in years. However, as the USD strengthened in late 2008, U.S. cheese became more expensive on the global market. As the price went up, the exports went down. As the exports went down, cold storage inventories went up and prices went down (see the graphs linked in the right hand panel).

There is a similar but reverse impact on cheese imports. When the USD was weak in early 2008, cheese imports were at the lowest levels in five years. Domestic cheese was less expensive. However, when the USD strengthened in the 4th quarter of 2008, imports surged.


Expressing it differently, if exports and imports are netted, the volatility over the last 5 years really shows.


Below is the weighted average value of the USD vs. 6 other major currencies. It's easy to see how the swings in the value of the USD parallel the exports and imports of cheese.


The price of Class III milk is really determined by the cheese price (April 7 post). The demand for U.S. cheese, which significantly influences the price, primarily varies with exchange rate fluctuations.


What's the short term outlook? The USD is strengthening, cheese prices are remaining low, and inventories are still high - not a pretty short term picture.

In an upcoming post the countries we export and import cheese to and from will be analyzed. Later, the long term factors influencing cheese and protein prices will be covered.

Thursday, April 9, 2009

What Makes Cheese Prices so Volatile?

Class III milk prices are very dependent (almost totally) on cheese prices (April 7 blog). Unfortunately, cheese prices are very volatile - as shown in the chart below. This volatility in cheese prices is what causes the huge swings in Class III milk prices.

Cheese pricing is determined primarily by supply and demand. What supply and demand factors make cheese prices so volatile? Let's first examine the biggest factor on the demand side.

Most of the cheese produced in the U.S. is consumed in the U.S. So the first thing item to explore is U.S. consumer demand for cheese? Below is the last 38 years of consumption data.


As can be seen from the graph, cheese consumption is not volatile and is in fact stable, growing nicely, and apparently very predictable.

Could U.S. consumer demand for cheese be "topping out"? Will future grow in cheese be slower than historical growth?

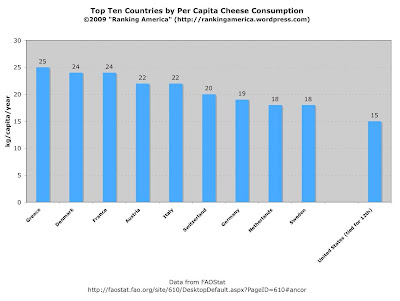
In the graph below, U.S. per capita cheese consumption is compared to a number of other countries. The U.S. is still far below many other countries, so there is little reason to think that U.S. consumption has topped out. (data is in kg - U.S. is on the far right)

It would appear that the steady growth in consumer demand that has taken place over the last 38 years can be expected to continue.

Now that one very large and obvious item has been identified as not contributing to volatility, we'll look at some other factors in an upcoming blog.

Tuesday, April 7, 2009

What Influences Class III Milk Prices? Only One Commodity!

The formulas for 2009 milk pricing are listed on the USDA site. Click on the link and it looks complex. Let's simplify it.

Two thirds of the dairy cows in the U.S. (~ 6M cows) are paid on the component system, so let's concentrate there.

There are only three underlying variables in all those equations - cheese, butter, and dry whey prices. How do variations in the price of these three processed commodities impact the milk check?

Below are three graphs that show how variations in these commodities cause the Class III milk price to vary. In each graph below, two of the variables are kept constant and only one is varied. The butter, dry whey, and cheese prices are varied over their normal ranges.

The butter price has almost no impact. When the price of butter goes up, the value of butterfat goes up, but the value of protein goes down! They are almost equally offsetting. The impact on Class III milk price is insignificant.

When dry whey prices increase, the milk check increases. But whey has such a small value that the impact on the milk check is minimal.

However, when the price of cheese goes up, the milk check gets really interesting!

It's not hard to see that only one commodity matters - cheese price. If you boil the Class III milk price formula down to it's simplest form, it looks like this. (I've rounded the numbers to make them more readable.)

Class III Milk Price = 9.6 x Cheese Price + 5.9 x Dry Whey Price + 0.4 x Butter Price - $3.17

The standard Class III formula assumes 3.1% protein, 3.5% fat and 5.9% other solids.

Combine the above with the cheese price impact on somatic cell count adjustment value (see the March 31 post to this blog) and it becomes clear that for two thirds of the cows in the U.S. , a producer's income is tightly linked to the price of cheese.

The impact is big enough that when cheese prices are high, a lot of operational shortcomings can be "covered". However, when cheese prices are low, it's tough for even the best operations to cash flow positive.

What influences cheese prices? Find out in an upcoming post to this blog.

Some comments please!

Friday, April 3, 2009

Class III Milk Pricing - Slightly Upward

April 3 is the date for release of the March milk component prices. Changes from February were upward with a 15% increase for protein and a 6% increase for butterfat.

Protein as usual is dominant in the Class III milk pricing. The pie chart below is calculated at 3.1% protein, 3.5% butterfat, and 5.9% other solids (the Class III standard calculation) and an average producer price differential of $1.42.


Obviously, protein is still the dominant element in the milk check.

Weekly cheese and butter prices were also updated today. Check them out through the links on the right. Prices remain stable and above year beginning lows.

Thursday, April 2, 2009

NASS vs. CME prices

The Federal Milk Marketing Orders calculate protein and somatic cell count payment value based on cheese prices. The most commonly quoted prices for cheese come from the Chicago Mercantile Exchange (CME). Those are not the cheese prices used to determine the value for protein and somatic cell count. The Federal Milk Orders use a market survey.

The National Agricultural Statistical Service (NASS) Market Survey runs about two weeks behind the CME published values.

Hoards Dairyman publishes the weekly cheese prices in graph form on thier website showing both CME and NASS prices. The graph above is through last week. The up-to-date numbers (both NASS & CME) are always available on the Hoards site at the above link.

The difference is timing between the NASS and CME releases allows one to get an early estimate of where protein prices are going. When the Class III protein price is released at the end of this week (April 3), it will be based on the last 5 weeks of NASS Market Survey prices. By watching the CME prices, you can estimate where the NASS pricing is going two weeks in advance.

The good news is that no matter which number you review, cheese prices are headed up.

This Friday, April 3 the March Class III prices will be announced - expect protein to be up slightly and fat up more.