Sunday, January 20, 2019

What Does the Class III Price Represent?

Response to the prior post on dairy pricing formulas has been very strong.  This post will build on that with an analysis of Class III price and what it represents.  The Class III price is often quoted in written material and conversations.  It is the basis for the initial milk payment for the majority of producers. When the Class III milk price goes up, payments to producers go up.  

The most recent Class III price announcement was made on January 3, 2019 and represents the Class and Component prices for December, 2018.  The price was a 
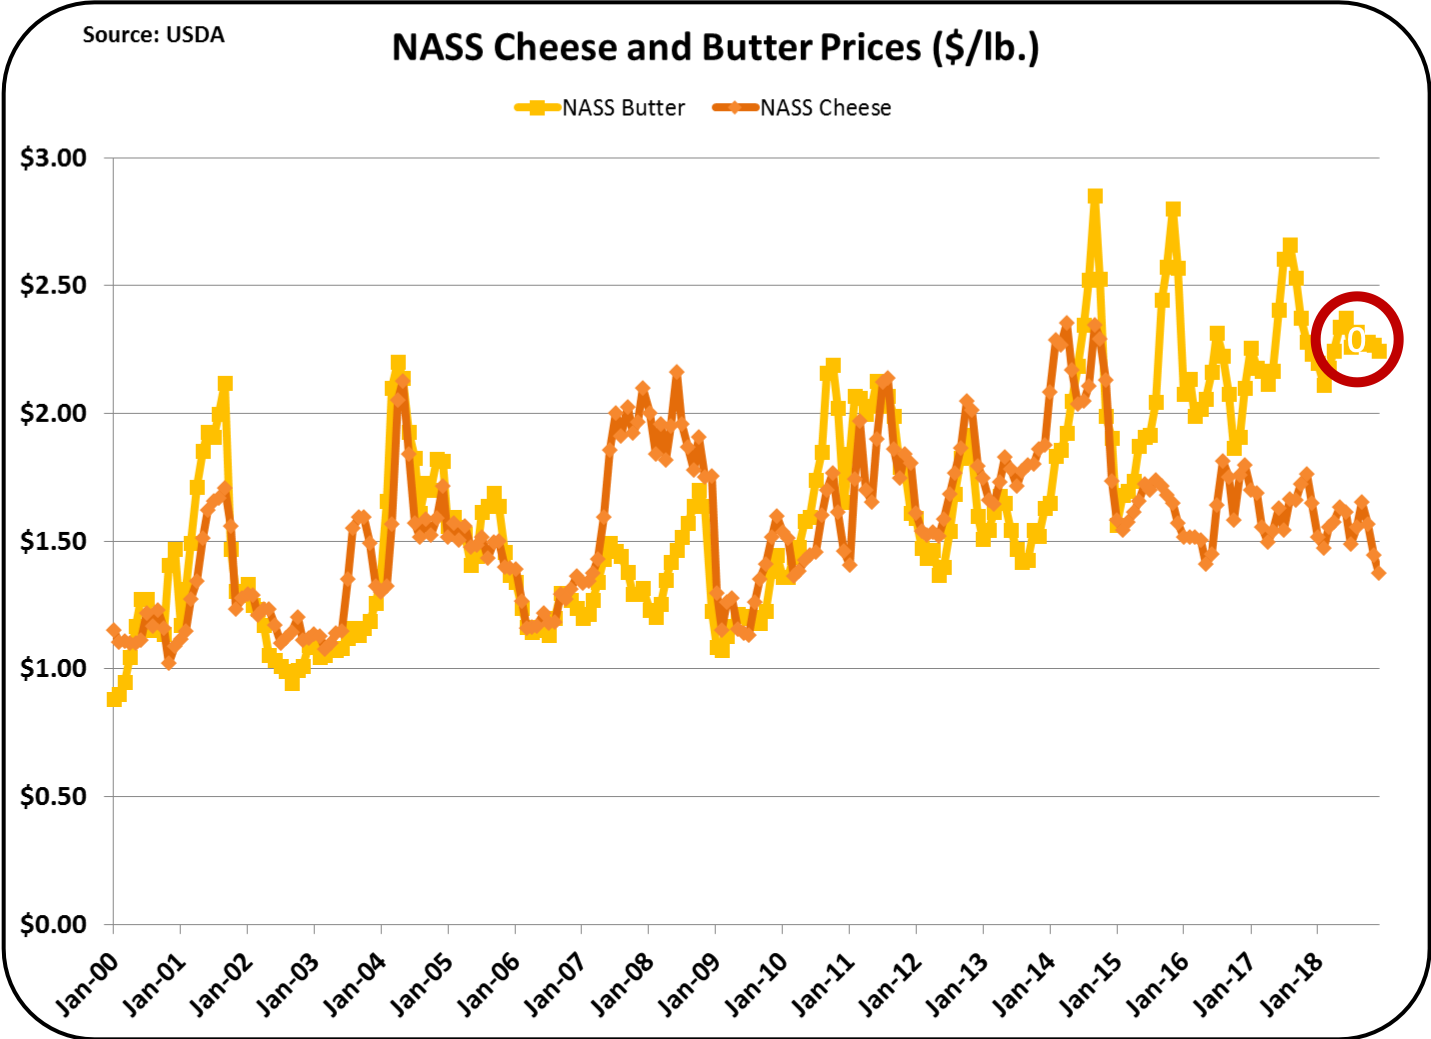
disappointing $13.78/cwt.   It was composed of butterfat at $2.5080/lb., milk protein at $1.1417/lb., and "all other" solids at $.2775/lb.  Calculation of the Class III price is based on skim milk at 3.1 percent protein, and "other solids" at 5.9 percent.  That calculates to a Class III skim price of $5.18/cwt,  

Butterfat is based on a 3.5 percent content in the milk which equals $8.78/cwt.  The final value for Class III is then 96.5 percent skim milk and 3.5 percent butterfat, which equals $13.78/cwt., the Class III price.

December Class III milk price = $5.18 x .965 + $8.78 = $13.78/ cwt.

The announced Class III price is only an index.  It is always based on milk with the same component levels, 3.1 percent protein and 5.9 percent "other solids" in skim milk and 3.5 percent butterfat.  That is what an index is.  An index price is based on a constant volume of components that makes it comparable with all other calculated values for prior months.

However, it is very rare that a producer supplies milk at exactly these component levels.  A more likely component level would be around 3.8 percent butterfat, with 3.2 percent milk protein and 5.9 percent "other solids" in the skim portion of the milk.  For that level of components, the effective Class III price would be $14.64/cwt.,  That price is $.86/cwt. or 8 percent higher than the published Class III index price.

Example Class III Price with higher component levels
 = (3.2 x $1.1417 + 5.9 x $.2775) x ,965 + 3.8 x $2.5080 = $14.64/cwt.

The standards used for the Class III milk price index were developed prior to January 1, 2000, when the current payment system was implemented.   The standards in the Class III index were probably reasonable standards at that time.  Because changing an index price makes it inconsistent with past statistics, an index is kept at standardized levels.

Increased component levels can increase producer revenue.  Further improvements in component levels can be achieved.  While $14.64/cwt. is not a sustainable price for most dairy production, it is certainly better than $13.78/cwt.  With just an additional 1 percent increase in protein and butterfat, the milk in this example would be worth $15/cwt.

Clearly, all effort to increase component levels for butterfat and milk protein can help improve dairy profitability.  Technology is available to achieve higher levels of butterfat and milk protein.  Implementation is being achieved in many herds today.

The majority of dairy products require only components.  Measurement of dairy productivity by pounds of milk is not an effective measurement.  The important statistic is component levels.  The current growth products like cheese and butter require only components. 

Sunday, January 13, 2019

Why are Milk Prices Low When Butter and Butterfat are at Record Highs?

Butter and butterfat prices have been at record high levels for the last four years as shown in Chart I below.   Never-the-less, producer milk prices have been low for this same time period as shown in Chart II below..  The low prices have made milk production unsustainable for many producers and have driven many producers out of business.  How is it possible to have record high butter and butterfat prices and still have unsustainable milk prices?  It's all in the formulas.

Chart I - Butter Price
Chart II - Class III Milk Price
This blog deals primarily with factual analytical data about the dairy industry. However, there are few posts about the formulas that play an important part in the analytics.  The reason is simple, most readers do not want to read about formulas.  While low readership is expected for this post, it will review some of the formulas not covered in detail in prior posts to this blog.

The first formula to be reviewed is the butterfat pricing formula.  As shown below, it is strictly based on the the price of butter.  The butter price is reduced by $.1715, the cost of churning butterfat into butter, and multiplied by 1.211 to adjust for the yield of butter from butterfat as water and other items are added to the butterfat.

Butterfat Price = (Butter Price - $.1715) x 1.211

This formula leads to a straight-forward linear graph which simply means that if butter goes up in price, so does butterfat (Chart III).

Chart III - Butterfat rises in value as Butter Increases in Value
The second formula to be reviewed is for milk protein.  As shown below, this is obviously a much more complicated formula.  The first part, ((Cheese price - .2003) x 1.383) is just the same form as the butterfat pricing formula with a price for cheese less the cost to make cheese times a yield factor.  However, there are a very significant additions to the formula.  The second part represents the incremental value of butterfat when it is used in cheese instead of butter.  That second part gives credit for the increased value of butterfat in cheese to the protein that coagulates to keep the butterfat in the cheese.  It makes sense when cheese is more expensive than butter. 

Protein Price = ((Cheese Price - .2003) x 1.383 +((((Cheese Price- 0.200.) x 1.572) - Butterfat Price x ..09) x 1.17)

However, at today's butter and cheese prices shown in Chart IV, butterfat is more valuable when it is used in butter than in cheese.

Chart IV - Butter and Cheese Prices Since 2000
If the formula presented above for protein pricing was collapsed to its simplest terms, it would look like this:


Protein Price/lb. = 3.222 x Cheese Price -1.275 x Butter Price - $.43

From the simplified formula above, it is obvious that as the price of butter goes up, the price of protein in milk goes down.  In Chart V below, as the cheese price stays constant at $1.50, and the butter price goes up, the price of milk protein goes down.  In fact, it goes down by an amount nearly equal to the increase in the price of butterfat.

Chart V - When Butter Prices Increase, Butterfat goes up and Protein Goes Down
In other-words, the milk price change overall is minimal as the price of butterfat and protein cancel out when butter changes in price.  Butterfat becomes more valuable while milk protein decreases in value. If the cheese price were to increase, it would increase the price of milk protein with no impact on the butterfat price.  Therefore, when cheese prices are high, milk prices are high. But the butter price has a very minimal impact on milk pricing overall. 


So, as long as cheese prices stay low, producer milk prices will remain low.


A producer can make more money if he increases the amount of butterfat or milk protein, but if the only thing changing is the butter price, revenue will be shifted more toward butterfat than protein, but the overall milk price will not be significantly changed.

The U.S. dairy industry is in an unusual period where cheese inventories are high, causing low cheese prices, while butter inventories are low, causing high butter prices.  As we enter into 2019, there are no apparent trends to change this.  Unless there are some changes in inventory levels, low milk pricing will continue while butter and butterfat remain high priced.


Sunday, January 6, 2019

2018 Class and Component Prices

 December Class and Component Prices were announced on January 3, completing the 2018 series.   It was not a good year for producers.  Class III prices ended the year at the second lowest price of the the year, $13.78/cwt.  The Class IV price ended higher at $15.09/cwt., the highest class IV price for the year.  Because the Class IV price was higher than the Class III price, it was also the basis for Class I milk pricing.

Butterfat prices were down 1.2 percent and cheese prices tumbled down 14.9 percent as cheese inventories remained very high.

Chart I - Dashboard of Price Changes
The Class III price has stayed in a very tight and low range for all of 2018.  The lowest was in February at $13.40/cwt. and the highest was September at $16.09/cwt.  There is no established trend higher or lower.  The reason behind the low prices, high cheese inventories, continues to plague the value of cheese, and in turn, plague the Class III milk price.

Chart II - Class III Milk Price
For much of 2018, cheese production, Chart III, has been 4 percent or more above the prior year, Cheese disappearance domestically has been growing at about 2 percent and exports have not been growing at all for most of 2018.  What is produced but not sold builds excess inventories (Chart IV).  The glut of cheese is the biggest problem currently limiting producer milk prices.  In 2017, the price of cheese averaged $1.64/lb.  In 2018, the price of cheese averaged $1.56/lb., a decrease of 5 percent.  Cheese production and inventory data are currently available only through October.

Chart III - Cheese Production
Chart IV - Cheese Inventories
The lower cheese prices also have an impact on the low Somatic Cell Count (SCC) adjustment paid to producers in the four middle U.S. FMMOs.  The value of the SCC adjustment is based on the cheese price, and as the cheese price decreases, so does the adjustment.  The adjustment begins to provide income when the SCC is below 350,000 cells per milliliter.  Current averages for SCC are around 200,000 cells per milliliter.  At current cheese prices this is worth only about $.10/cwt.

Nonfat Dry Milk (NDM) prices have improved slightly in 2018 ending the year at $.90/lb.  For the year 2018, the NDM price was 8 percent lower than the prior year price of $.87/lb.  However, by year-end 2018 the December price has recovered to $.90/lb.  NDM includes Skimmed Milk Powder (SMP) which is primarily an export item.  The majority of NDM/SMP is exported and the price is based on supply and demand in the international markets.  Most of the U.S. exports go to Mexico.

The NDM price is the basis for the Class IV skim milk price.  During the year 2018, the Class IV skim milk price has increased from $4.71/lb. in January to $6.54/lb. in December, a 38 percent increase.  The current price is still way below historic price levels.
Chart VI - NDM Prices
When the price of Class IV milk is higher than the price of Class III milk, the Class IV price becomes the basis for the skimmed milk price of Class I & II.  In turn, this can increase the "Uniform" milk price (weighted average price) above the Class III price resulting in a higher Producer Price Differential (PPD) payment to producers.  While these are typically small amounts, in a time of tight prices any "small amounts" are appreciated.  The PPD is larger in FMMOs like the Northeast with more Class I milk.  In December, the PPD for the Northeast Federal Order was $2.18/cwt., while the PPD for the Upper Midwest, which has a very limited Class I business, was $.30/cwt.

Butter prices have been very stable in 2018.  They have ranged by only 13 percent, with a low of $2.11/lb. and a high of $2.38/lb.  The prior year range was 26 percent, twice the 2018 price range.  This signals a significant reduction in butter pricing volatility.   On the average, the butter price was 3 percent lower in 2018 compared to the prior year and ended the year at almost exactly at the same price as the prior year.

The spread between butter and cheese prices reached $.87/lb. in December as cheese prices hit a low point for the 2018 year (Chart VII).

Chart VII - Prices of cheese and Butter
Butter production has increased in the last three years to meet demand (Chart VIII).  As a result, inventories have increased to reasonable levels as well.  Another indicator is exports.  Although exports are still minimal, they have increased from prior years.  As covered in the prior post on imports, imports of "Irish butter" have increased significantly in 2018, also taking the heat off of the tight butter inventory levels.  It would appear that there might be some softening of U.S. butter prices in 2019.

Chart VIII - Butter Production
In summary, 2018 has been a tough year financially for milk producers.  While market volatility of butter prices has settled down, the extremely high inventories of cheese have depressed cheese prices.  Cheese prices are the primary determinant of the Class III price.