November Class III milk and Component prices were released on December 5. Milk protein and the Class III milk price were down considerably, and butter and butterfat were down slightly. The Class III price fell to $14.44/cwt., about 7% lower than the prior month and 14% lower than November 2017.
 |
| Chart I - Monthly Gains of Loses Compared to the Prior Month |
The Class III price remains within the tight pattern it has been in for the last four years. (See the
November 11 post for more details on the "new normal." The data for the last four years shows no significant trends for improvement. The November price of $14.44/cwt. is in the lower quartile of prices over the period from January 2015 to the present.
 |
| Chart II - Class III Milk Price Since January 2015 |
What is driving the low milk price is the high inventory of cheese being carried. For the linkage between the cheese price and the Class III milk price see the
prior post. A case could be made that cheese prices could be worse based on current inventory levels.
 |
| Chart III - Cheese Inventories by Year |
The long-term cheese inventory levels are shown in Chart IV. The trend line can be used to compare the current inventory levels to the "appropriate levels" represented by the trend line. The growth of cheese inventories above the trend line is obvious. A case can be made that the cheese inventory levels are in the neighborhood of 50 million pounds too high. If changes are not made, it will continue to grow.
 |
| Chart IV- Cheese Inventory Compared to Growth Trend Line |
As reviewed in prior posts, exports of cheese are not growing. While there may be some impact from the current tariffs on cheese exported to Mexico, that impact could not begin to match the 50-million-pound bulge in inventories. Production is simply too high, and that production is being pushed by too much milk.
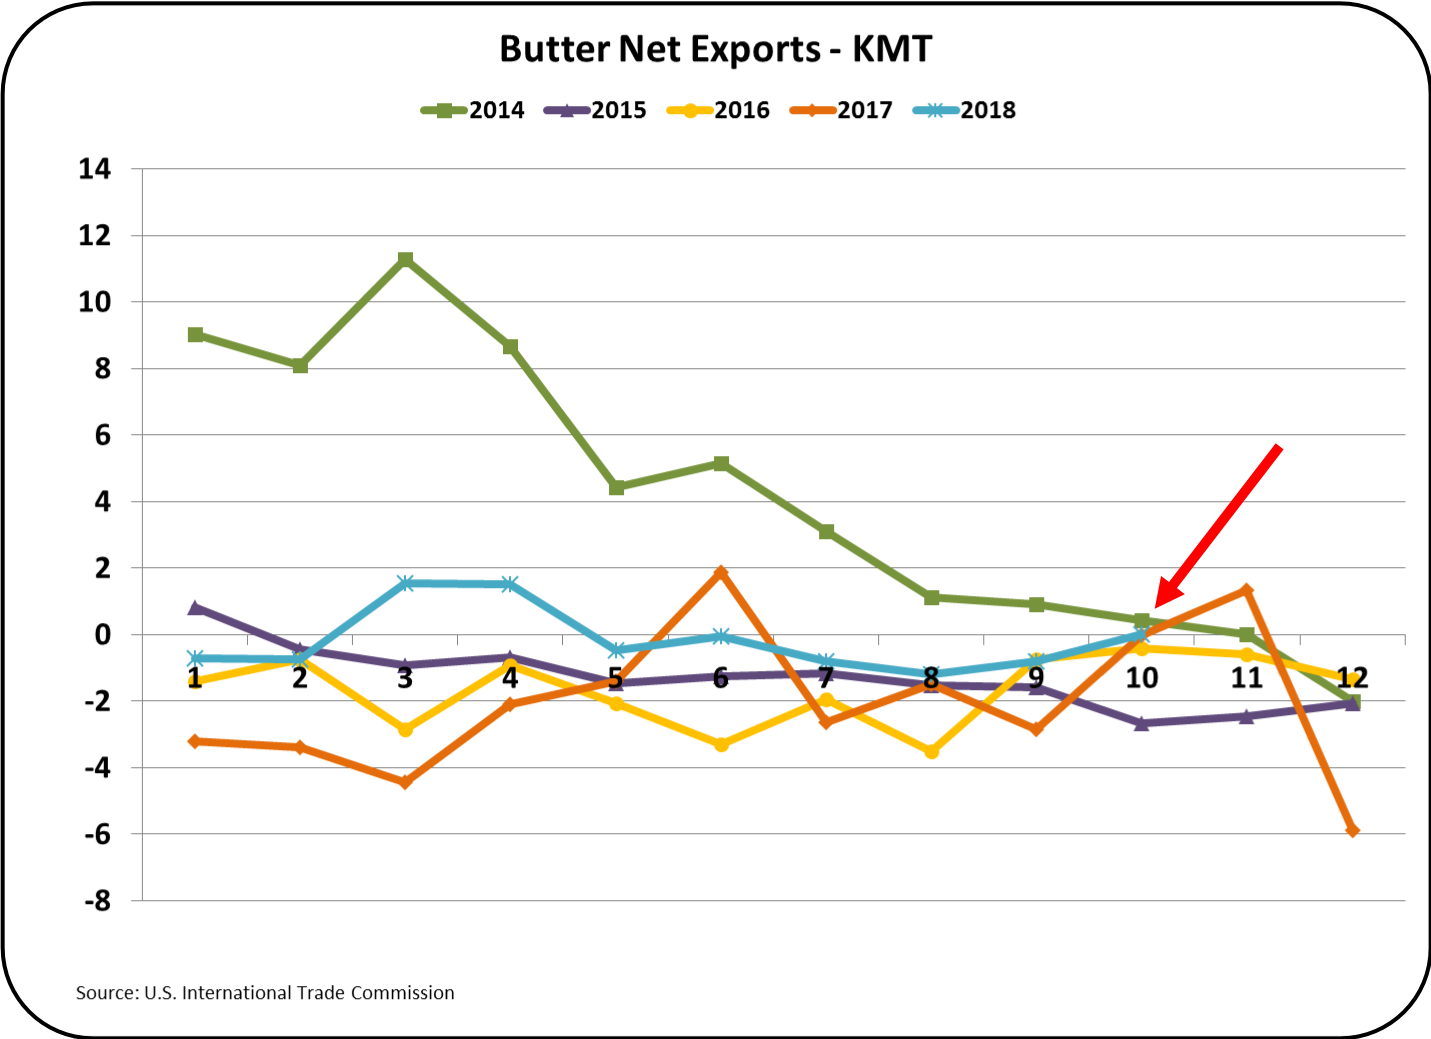
Butter prices remain in the higher level established starting in 2015. For 2018, butter has traded in a very tight pattern, ranging from $2.11/lb. to $2.38/lb. The current price of $2.27/lb. is near the midpoint of the four-year and one-year range in butter prices. There was a very slight downturn in the butter price from the prior month which had very little impact on overall pricing.
 |
| Chart V - Butter Pricing since January 2000 |
Butter inventories remains very close to the prior year in spite of the growing consumption of butter. The tight inventories remain very close to prior years. The tight inventories are keeping butter and butterfat prices high.
 |
| Chart VI - Butter Inventory Year by Year |
The Class IV skimmed milk price is derived from the price of Nonfat Dry Milk/Skimmed Milk Powder (NDM/SMP). NDM/SMP increased slightly in price (Chart VII). This resulted from the continuing drop in inventories of NDM/SMP (Chart VIII).
 |
| Chart VII - NDM/SMP Prices |
 |
| Chart VIII - Inventory of NDM/SMP |
While the current price of NDM/SMP is still in the low-price range for NDM/SMP, it did increase the Class IV price enough to make it higher than the current Class III price (Chart IX). When the advanced Class IV skimmed milk price is above the Class III skimmed milk price, the Class IV price is used as the basis for Class I milk pricing. This in turn increases the uniform milk price and Producer Price Differentials and provides slight benefit for producer prices.
 |
| Chart IX - Class III and Class IV Milk Prices |
The price of Other Solids is calculated based on the price of Dry Whey. Dry Whey inventories dropped in March of this year and have remained low throughout the year (Chart X.)
 |
| Chart X - Dry Whey Inventory |
The price of Other Solids has increased from a low $0.06/lb. in early 2018 to $0.27/lb. in November. This has changed significantly the makeup of the Class III price (Chart XI). In November, Other Solids made up 11% of the Class III price. In January 2018, Other Solids made up only 3% of the Class III price.
 |
| Chart XI - Component Contributions to the Class III price. |
Behind all of the price changes analyzed above, the level of inventories has been the primary cause. The biggest problem facing producer prices is the huge high inventory of cheese. Producer prices cannot be improved until actions are taken to reduce the cheese inventory.