Sunday, December 14, 2014

Dairy Exports Drop

In the prior post, the fall in dairy commodity prices was analyzed.  While new export data was not available at that time, they were suspected as the culprit.  Export data became available shortly after that post and will be analyzed in this post.  As suspected in the prior post, dairy exports did fall significantly.  This post will analyze the export data.

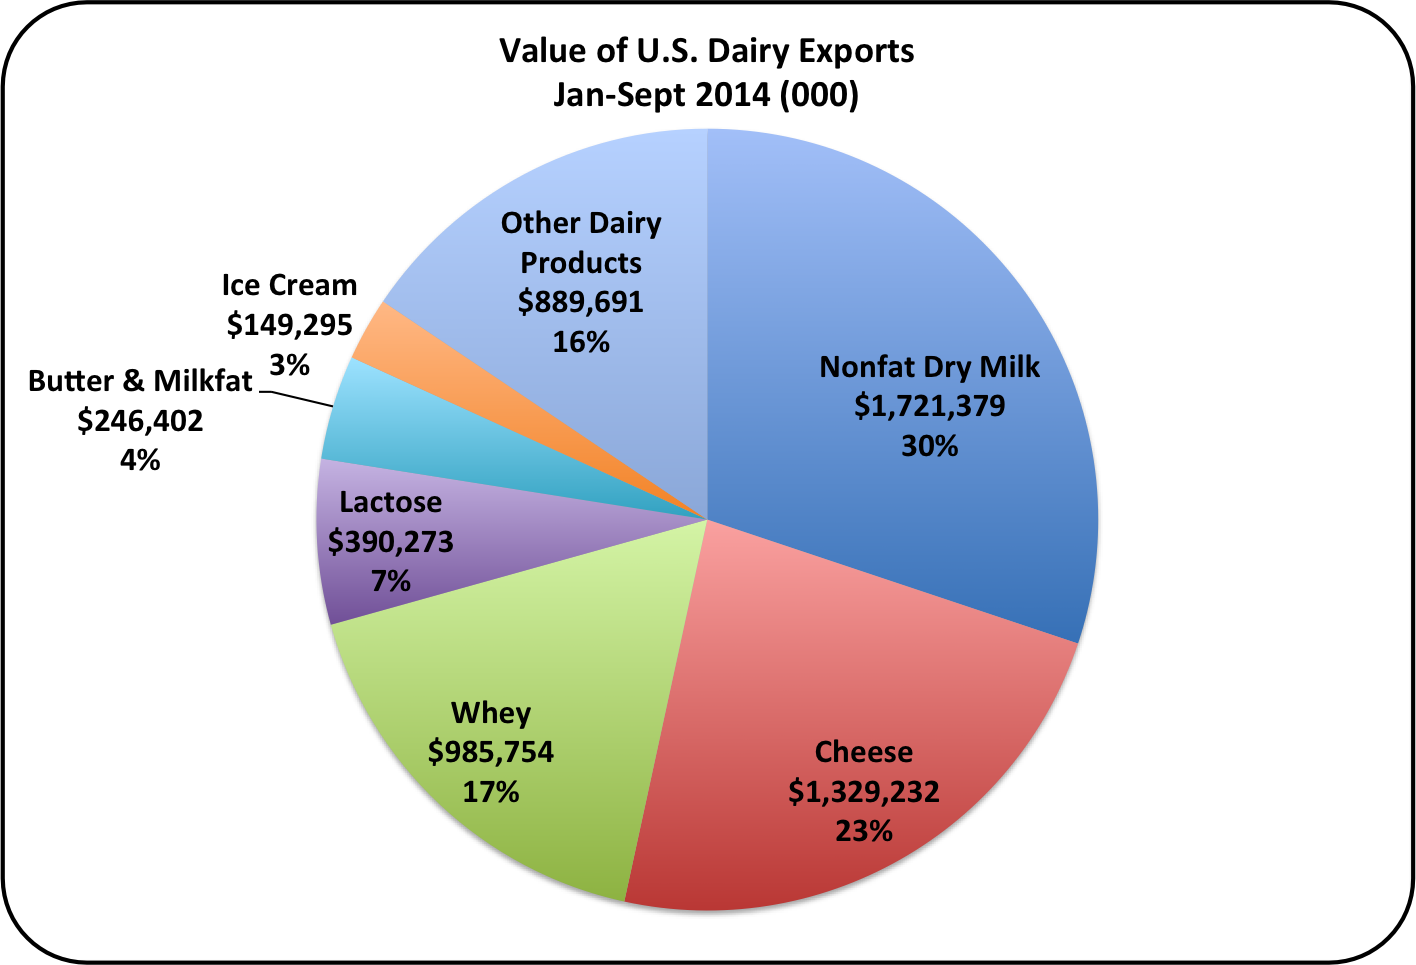
To put things in perspective, the pie chart below shows the values of export categories for the first nine months of 2014.  They total 5.7 billion dollars and account for 15.5% of the U.S. dairy production.


Nonfat Dry Milk is the largest category in USD, and has a much larger share in tons exported.  In 2013, the U.S., for the first time, became the world's largest exporter of Skim Milk Powder/Nonfat Dry Milk, exporting 555 thousand metric tons.  The chart below shows the other SMP/NDM exporting countries.  The EU and New Zealand are major exporters of SMP/NDM, and competitors for this business in the international markets.


For the first ten months of 2014, the U.S. has exported 469 thousand metric tons of SMP/NDM.  To match 2013's volume level, the U.S. would have to export 43 thousand metric tons in November and December.  Exporting that level is still possible, but for the last two months, the U.S. has been below that level.  In October, there was a slight gain in exports, so recovery may be in process to meet the 2013 record export levels.


Prices for SMP/NDM have fallen internationally.   International prices are important because to date, 54% of the U.S. SMP/NDM have been exported.  The Export price closely matches the domestic price.  As shown in the chart below, the U.S. has held prices above the EU and Oceania, but that higher pricing is hurting export volumes.  With higher prices export volumes will not recover, domestic inventories will increase, and domestic prices will fall.  On the other hand, if prices are lowered on exports, domestic prices will also fall.  Either way, a domestic price decline is likely.


Cheese is probably the most important product to review. This is because the price of cheese, as determined by NASS, is the major variable in pricing milk.  Cheese exports have more than doubled in the last five years and now account for 7.4% of production.  However, that export volume is declining.  If volumes continue to decline, it can quickly bloat domestic inventories and hurt domestic prices.  Traditionally, Mexico is the largest export customer for the United States.  In October, Mexico's imports fell 16% from their 2014 running rate and South Korea became the largest export customer.  This may be a short-term situation, but bears watching.


The biggest export drop was in butter.  The all time high volume of butter exports occurred in March 2014 with over 12,000 metric tons exported.  This depleted domestic inventories and caused historically high butter prices.  In October, just over 2000 metric tons were exported.  This should certainly allow domestic stocks of butter to recover.  For a view of butter stocks over the last six years, click here.


Currently butter prices are declining and are expected to fall further.  This fall will bring butter prices more in line with long-term trends.  As long as churning capacity is not increased, the U.S. cannot be a major butter exporter. For a view of butter prices, click here.

Dry Whey is the fourth and final commodity, which directly influences producer prices.  To date, 60% of the dry whey produced has been exported.  Exports remain strong, and dry whey prices are maintaining the level of 2014 prices.  As a result, the price paid producers for "Other Solids", which is based on the dry whey price, also remains healthy.


There is one other market of interest, because it is a developing market for the U.S.  Whole Milk Powder (WMP) does not have a market in the U.S.  This is due to adequate refrigeration of fluid milk, excellent logistics for fluid milk delivery, and consumer buying habits.  WMP is strictly an export market, dominated by one major buying customer, China.  Production and inventories have varied tremendously.  However, WMP exports, while small, are the strongest growing U.S. export item.  WMP exports are up 46% YTD.  Recently the market has cooled off and exports are tracking at last year's level.  U.S. exports of whole milk powder are only about 10% of those for SMP/NDM.  This is a market of high risk, but it is the largest export category globally and penetrating it could have big returns.

EXCHANGE RATES

Exchange rates are adversely impacting dairy exports.  The strongest impact is vs. the Euro.  This comes at a time when Europe's dairy industry is concerned about over production as a result of the recently implemented Russian embargo.  The European dairy industry needs to export more dairy products and a weak Euro helps them accomplish this.


The NZD has also weakened against the USD, helping New Zealand export their dairy production.


The EU and New Zealand are the two largest dairy exporters, and represent strong competition to the U.S.  The strong USD gives these competitors a pricing advantage.

CONCLUSIONS

Producer milk prices, as predicted in the CME futures market, show prices falling by 1/3 from the 2014 highs in the next few months.  Cheese prices, which are the primary basis for milk prices, are similarly priced.  This assumes a continuing drop in cheese exports that will bloat domestic inventories and cause prices to drop.  An examination of cheese exports in detail doesn't support this.  The long-term best customer for cheese is Mexico.  In October, their imports were off, causing them to be the "second best" customer after South Korea.  We do continue to see increasing U.S. cheese exports in many other parts of the world, notably in the Far East counties.

Exports to Mexico, that have dropped in the last few months, are not reason enough to expect a long or even a short-term trend of decreased exports to Mexico.  While the future is always uncertain, exchange rates between the Mexican Peso and the USD have shown only a slight strengthening of the USD.  It would therefore be reasonable to expect exports to Mexico to increase to the prior higher levels.  With the strengthening of cheese exports to other parts of the world and a recovering market in exports to Mexico, a stable to increasing level of cheese exports is not unreasonable.  With that would come strengthening prices for cheese and milk.

As for SMP/NDM, lower prices continuing well into 2015 are reasonable.  The contribution of the high SMP/NDM prices in 2013 and early 2014 were the basis for a nice addition to milk prices, but not of the magnitude of cheese prices, so their impact should be less.


Sunday, December 7, 2014

Dairy Commodity Prices Fall

On December 3, 2014, November Class and Component prices were announced.  All underlying commodity prices that impact milk component prices fell.  Cheese prices fell 7%, butter prices fell 21.2%%, dry whey fell 2.5%, and Nonfat Dry Milk (NDM) fell 6.7%.  Class III milk prices fell 7% to $21.94, a lower but still excellent price.


As shown in the "INVENTORIES AND PRICING" section below, inventories of these commodities do not show anything out-of-line.  However, the CME futures market is portraying a coming broad price drop in these commodities.  

Exchange rates are showing a significant strength in the USD which adversely impacts exports.  New export data is not available as of this date, and will be published in this blog as soon as it is available.  Dairy solids exports are hovering near 16% of total dairy production. With this large and volatile export market, exports can drastically effect domestic pricing of dairy products.

The most major drop was in the price of butter, falling by $.54/lb. which equates to a 21.2% drop. This drop has been widely anticipated as the record high prices for butter were unsustainable.  

The one positive number on the dashboard above is the price of milk protein.  Milk protein is up only because of the significant drop in the price of butter.  The price of milk protein is based on the price of cheese plus an adjustment for the higher value of butterfat when used in cheese rather than butter.  Those elements of the milk protein price are shown in the chart below.


Long term component price trends are returning to more normal levels, with the value of milk protein once again well above the price of butterfat.  Protein at $3.90/lb. is 77% greater than the current price of butterfat which is $2.20/lb. 


The pie chart of producer revenue below is based on the November component prices and the USDA standards of 3.5% butterfat, 3.0% protein, and 5.7% other solids.  Once again, payment for protein is making up the majority of the milk check.


INVENTORIES and PRICES

Typically, low component prices are the result of high inventories of the commodities that are used to calculate the milk component prices.  However, these inventories are not significantly out-of-line as shown below.  Therefore, the lower component prices can only be attributed to events that could cause the future inventories to balloon. 

Cheese inventories are slightly low, and below the year ago levels of October 2013.  Considering the increased domestic consumption of cheese, increased cheese production, and strong 2014 cheese exports, the current inventories are at reasonable levels and do not suggest a lower price for cheese caused by high inventories.  (By clicking on the charts a larger version can be displayed.)


However, the current NASS price of cheese is falling and the CME futures price of cheese is also falling.  The average November price of cheese fell $.16/lb. or 7%.  In 2014 there have been record high prices for cheese and the current price is still a relatively high price.


Butter inventories remain low, and below the four prior years of inventories for the end of October.   These inventories also do not provide a reason for the lower prices.  Strong exports in late 2013 and early 2014 caused inventories to shrink.  Production of butter has not increased from historical levels to allow recovery of these inventories.  However, exports have dropped recently, and this may be creating an expectation of increasing future inventories.


The price of butter has seen a significant drop from the recent record high levels.  The current  NASS wholesale price of butter at $1.99/lb. is still a lofty price compared to historical prices.  The September extreme record price ($2.85/lb.) was an abnormality, that in hindsight appears to have been irrational.


Inventories of Dry Whey and Nonfat Dry Milk are also both in reasonably good shape as of the end of October.


Dry Whey and NDM are both primarily export commodities.  Through September 2014, 60% of Dry Whey production has been exported and 56% of NDM production has been exported.  Pricing for these commodities is tied to international prices, and both are falling.

CURRENT NASS AND CME FUTURES

Although the above inventories do not indicate that price declines should be expected, the CME futures prices are showing a significant price drop.


The green line representing the price of cheese in the above graph shows a significant drop in cheese prices in December.  Cheese and Class III milk prices are highly correlated.  The chart below shows that the CME futures are maintaining this close correlation.


There is only one justification for the decline in the futures market pricing for dairy products.  The strong USD is expected to decrease export sales and thereby increase inventories and decrease prices.  When new data on exports is available, a new post to this blog will show the more current data on exports.

Sunday, November 9, 2014

Butter Prices Fall

On November 5, October Class and Component prices were announced.  The Class III price stayed excellent at $23.82/cwt., near record high levels.  Butter and butterfat dropped by 12% from the prior month.  Based on the weekly NASS and CME price trends, butter and butterfat will continue to drop.

The most important commodity for milk pricing is cheese, which fell only slightly to $2.29/lb.

Milk protein increased by 6.8% due to the drop in price for butter.  For an explanation of this relationship, see the August 8, 2010 post to this blog.


The current component prices have shifted to more closely match the long-term trends.  Milk Protein is continuing its trend of increasing value.  Butterfat prices fell and will continue to fall as explained below.  As butter prices continue to fall, and cheese prices remain stable, the value of milk protein will continue to increase.


The drop in butterfat prices and the corresponding increase in milk protein prices have started to return the pie of component values to a more normal split with protein contributing the most.  Pricing for "Other Solids" remains stable, contributing $2.66/cwt. to the Class III price. 


Exports have played a major role in the October changes.  The U.S. is exporting less as the international market gets more competitive and the USD strengthens.  More details on exports are covered below.

BUTTER

Butter stocks remained tight at the end of September, which is the most current data available.  For months, there has been very little butter traded as most all butter inventories are being used to fulfill contract commitments.   What has been available for sale has gone at extremely high prices.


The fall in the price of butter has dropped every week in October.  Butter prices on the CME fell from $3.09/lb. for week of September 25 to $1.95/lb. just four weeks later.  The CME prices reflects the very thinly traded exchanges of butter available at auction.  The NASS butter value is based on a broader survey of butter sales and in times of butter shortages is less volatile.  The chart below shows the weekly NASS and CME butter prices.  The October NASS butter prices used for milk pricing reflect a monthly average of the declining prices which includes the higher prices in early October.  Because of this, November NASS butter values will certainly show more deterioration in prices.


Butter exports fell significantly in September as the U.S. was priced well above the EU and Oceania.  The chart below shows the 2014 spike in U.S. butter prices compared to other exporting regions of the world.  In October, the U.S. prices fell significantly, but will have to fall further to be price competitive in the international market.


CHEESE

Cheese prices, inventories, exports and production are all staying in good balance.  Cheese prices are tightly linked to the Class III milk price as shown in the chart below.  Class III milk is the largest of the four Classes and also controls the second largest category, Class I.  Therefore, the cheese prices are extremely important to overall milk pricing.   As long as cheese prices are good, Class III milk prices will be good.


 Cheese inventories are in line; not too high, but at reasonable to slightly low levels, which should make for stable operations and pricing.  As long as inventories do not rise, the price for cheese will remain close to where it is now.


Monthly cheese exports through September are all monthly record highs.  However, beginning in April, the increase over prior year has gotten smaller and smaller.  Over 50% of U.S. cheese exports go to Mexico, Japan, and Korea.  The exports to Mexico are long standing and familiar brands are important to the tourist trade.  Japan and Korea are actually closer to New Zealand and sales to these countries could be at least partially in jeopardy.  These exports will be followed in future posts to this blog.


Cheese production has risen to meet domestic and export demand in a controlled manner.  This has helped keep inventories in line.


A concerning element is exchange rates.  As the USD gets stronger, U.S. dairy products become more expensive vs. the global competitors.   On the charts below, the USD is getting stronger against both the Euro and the NZD.  Europe and New Zealand are the two biggest dairy exporters, and both export more than the U.S.  This is where the competition for U.S. dairy exports comes from.   During 2014, the USD has strengthened by nearly 10%.  If the USD gets even stronger, it will force the U.S. exporters to reduce pricing and/or lose volume. 


Where are prices going?

The futures market for Class III milk indicates a weakness in the coming months, with prices falling to the $17/cwt. area.  This will only happen if cheese exports fall and inventories rise.  While this could happen, with aggressive pricing in the international markets, there is also a good chance that exports and cheese pricing will remain healthy.  

Sunday, October 5, 2014

Butter: Déjà vu - all over again

Class and Component prices for September were announced on October 1.  As shown below, prices were generally up.  Class II and III milk and butterfat were at record highs.  Butter prices which have been at record prices, hit a significant new record of $2.85/lb. in September.   Cheese prices are also near record highs, but the extremely high price of butter/butterfat have kept milk protein prices from reaching similar highs.  For an explanation of this relationship, see the August 8, 2010 post to this blog.


In this post, each of the key commodity elements influencing producer milk prices will be reviewed.

Butter prices are again the real story.  Butterfat prices are driven by the price of butter.  Butter has risen from $1.65/lb. at the beginning of 2014, to September's price of $2.76/lb. This has, in turn, raised the price of butterfat to an extreme record high of $3.25/lb.  Inventory levels are extremely low driven by high exports earlier this year and by stagnant production levels to date.  An adjustment will occur between supply and demand, but for now, the high demand and stagnant production are forcing extremely high butter and butterfat prices.  More details on the butter market were reviewed in the August 10, 2014 post to this blog.  There are consumption alternatives to butter and the high butter prices could drive consumers to trial other spreads and perhaps never return to butter.  These trends will be followed as data becomes available.


Cheese prices were also near record levels at $2.35/cwt.  Production continues to grow, inventories are at reasonable levels, exports continue to grow and domestic consumption continues to grow.  The only concern here is that high cheese prices at the retail level have been shown to reduce domestic consumption.  The wholesale prices shown below will drive a higher retail price, and slow the growth of per capita domestic consumption.


The bad news in the current dairy prices is Nonfat Dry Milk (NDM).  NDM is the basis for the Class IV milk price.  The majority of NDM is exported, so the price really reflects the international price, which has been falling.  The current price of $1.47/lb. is well below the March 2014 high of $2.09/lb.  In early 2014, NDM and the Class IV skim price were driving the overall high milk prices.  At $11.62/cwt. of skim milk, the current price is still a good price, but not near record levels of $17.12/cwt. set in March 2014.  Unfortunately, inventories are starting to grow which combined with lower international prices, will probably drive the NDM price down further.


The producer price paid for "other solids" has been contributing nicely to the overall Class III milk price for the last three years with prices around $.50/lb.   The basis of "other solids" pricing is the price of dry whey. Dry whey continued to maintain a good value in September with a price of $.67/lb., up 14% over the 2013 average price.   The majority of dry whey is exported, so this price reflects the international price.

The long-term trends are difficult to read with the recent volatility.   The current butter shortage is skewing the data.  It is keeping butterfat prices very high and preventing growth in the most valuable part of milk, protein.  For more on the future value of various milk components, see my article in Progressive Dairyman.  The high price of butter will change, but the data will remain and influence the trend lines.   


The following pie chart of the component contributions to the Class III milk price, shows an ever more skewed distribution.  In September, butterfat contributed the largest value, making up 46% of the Class III price.  "Other solids" continue to contribute around 11% to the Class III price, and milk protein showed a significantly smaller contribution at 43%.  As mentioned above, the increase in butterfat prices has a negative effect in the value of protein.


The high price of butter significantly changes the pie chart of income.  The high price of butter does not significantly influence the Class III milk price, but it does alter the skew between the contribution by milk protein and butterfat.  For a review of this relationship, please see the April 23, 2014 post to this blog.

Exports are increasingly influencing the U.S. dairy industry.  In the first seven months of 2014, 16.4% of milk solids were exported.  Unfortunately, international involvement increases the pricing volatility of the U.S. dairy business.  Right now it is very positive, but as seen in 2008/09, this could reverse.  For more on exports, read my recent publication in the Dairy Reporter.


Sunday, September 7, 2014

Déjà vu

Class III milk and component prices for August 2014 were announced on September 4.  The Class III price was near record levels and the Class IV price was a record.  The big news is again the price of butter, which has shot to record levels never seen before.  An in-depth review of the reasons behind the very high butter prices was covered in the last post and will not be repeated here.

Protein prices dropped slightly in spite of an increase in the NASS price of cheese.  The NASS price of butter was up 7.8%, which increased the price of butter, but decreased the price of protein.  For an explanation of this mathematical relationship, see the August 8, 2010 post to this blog.


The long term trends shown below reflect the current component pricing situation.  Butterfat is at a significant record price.  Inventories of butter remain low which was caused by very strong exports. Butter churning has yet to catch up.  The August drop in the price of milk protein is totally the result of the record high butter price.


The pie chart below shows a very unusual component make-up of the August value for Class III milk.  Butterfat is now contributing more to the Class III price than milk protein is contributing.


As expected, the price of nonfat dry milk, which is the basis for the Class IV skim price, fell slightly.  The global market price of nonfat dry milk/skim milk powder is falling, and the NASS price is really governed by the global price as the majority of U.S. nonfat dry milk is exported.  In spite of this drop, the still high Class IV skim milk price and the resulting differential between Class IV and Class III skim milk prices, continues to benefit most all U.S. dairy producers.  See the February 14, 2014 post to this blog for an explanation of this relationship.

INVENTORIES

Inventories of both butter and cheese are low.  The most significant of these is the butter inventory. As of the end of July, the butter inventory is lower than anytime in the last six years.  (August data is not yet available.)  Exports in late 2013 and early 2014 depleted butter inventories and churning has not increased sufficiently to rebuild these inventories.


As shown in the chart below, butter churning is running at the level of the last four years, and this level does not allow recovery of the low inventories.  With the extremely high butter prices, there should be a strong incentive to produce more butter.  However, the Federal Milk Marketing Order pricing model pegs the price paid for butter churning and this "make allowance" has not changed in years.  Therefore, butter churners are paid the same price per pound for all butter churned and the benefit of the current high butter prices falls to the dairy producers.  Other than the standard make allowance for churning, there is no additional incentive to churn additional butter because of the low inventories.


The current level of exports may be playing a role here, but current export data will not be available for August until mid October.

Cheese inventories are also very low.  Cheese consumption and cheese exports are both growth categories and inventories should be increasing to keep the days of inventory constant.  This is not happening and when inventories are low, prices will rise.  Natural and American cheese inventories are shown below.


The NASS price of cheese did increase in August, but it is not near record levels.  The NASS cheese price in August was $2.11/lb., above the prior month of $2.05/lb., but well below the early 2014 record prices, which peaked at $2.35/lb.


Dry Whey prices are the basis for pricing "other solids."  Dry whey is principally an export item.  In August, the price of dry whey was $.69/lb., a current record and up slightly from the prior month.  "Other solids" continue to contribute nicely to the Class III milk price.


Whole milk powder has a huge international market.  While the U.S. has not significantly participated in this market, there has been some production and export activity recently.  This export market appears to have fallen apart again and inventories have skyrocketed.  As a result, production has quickly fallen off. This is a very volatile market with a history of difficulty.  Whole milk powder is only a small niche market in the U.S., and is discussed here only because of the dramatic change. 


The dairy business is always changing and the dynamics of becoming a global exporter have increased the volatility.  Overall, producer prices for milk are currently very positive, mostly the result of strong exports.  The new and developing trends will always be reviewed in this blog.