Sunday, February 26, 2017

U.S. Dairy Exports and Imports - Part Two

In the prior post, 2016 exports and imports of cheese and dry whey were examined.  This post will examine the 2016 exports and imports of the other two dairy commodities that are used to calculate producer dairy prices.  Those commodities are butter and nonfat dry milk (NDM).

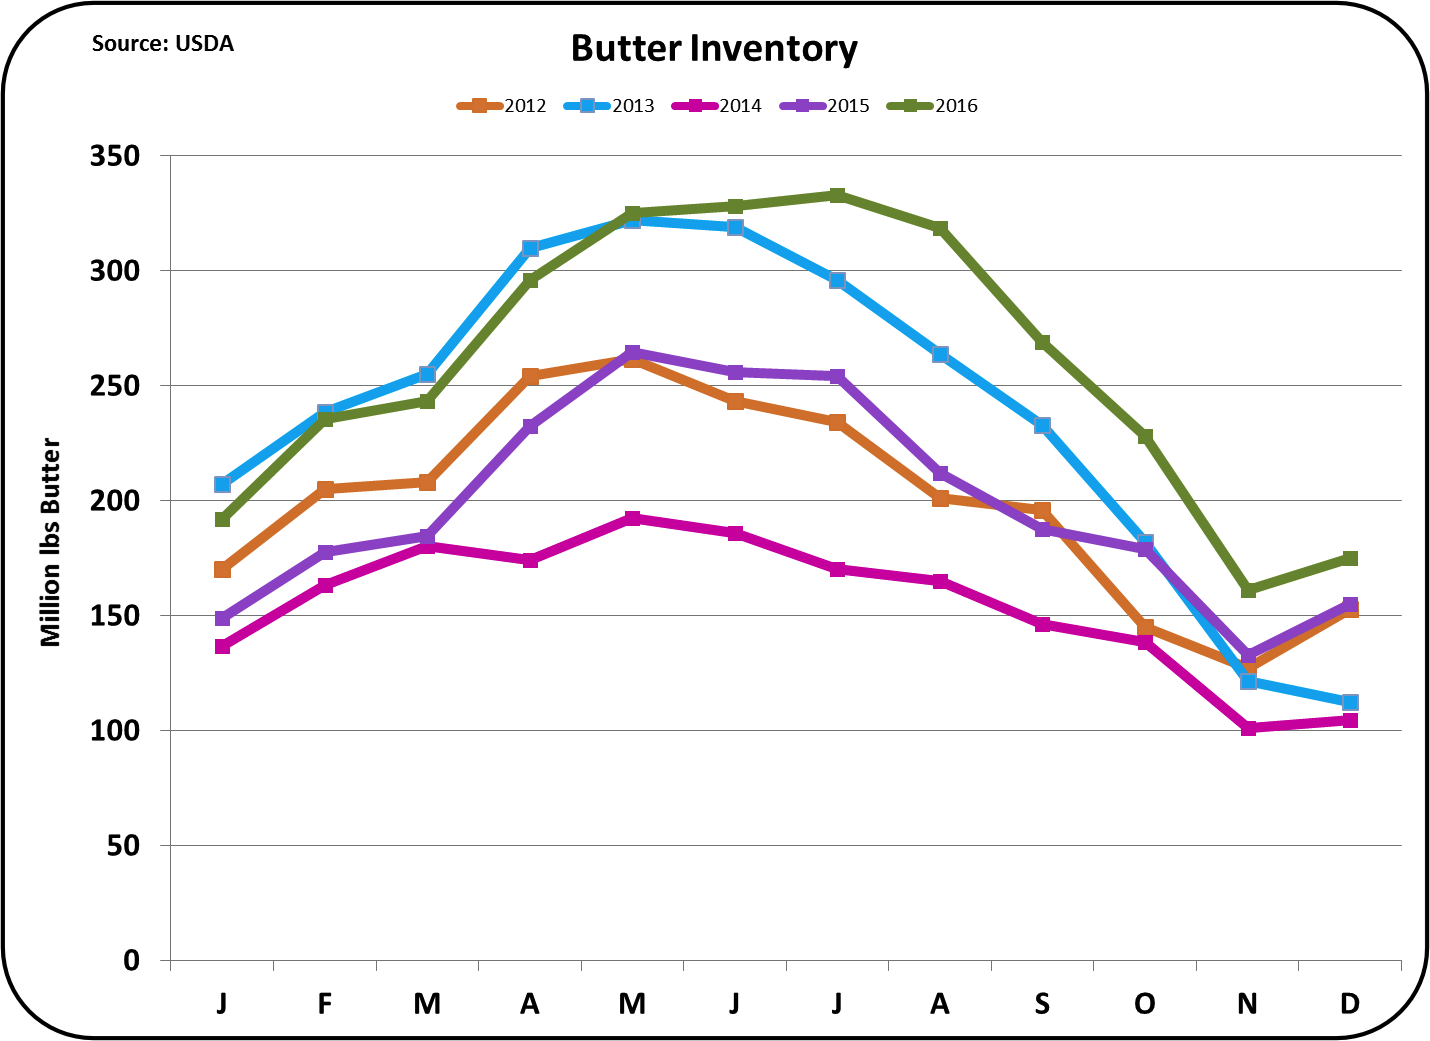
Butter exports remained extremely low as U.S. prices for butter were well above international prices for most of 2016. Increased consumer demand for butter in the U.S. combined with lower U.S. production has kept U.S. stocks low and prices high.


The little butter that is exported is primarily going to Canada and Mexico (see chart below).  Canada has a very protective dairy industry, which does not allow any imports except for a few specialty products.  The Canadian dairy import market is protected by exclusion from NAFTA and trade agreements with other countries.  So why is Canada our largest butter export market?  The Canadian dairy industry is isolated with almost no exports and tight restrictions on imports.  The payment system is very favorable for Canadian dairy producers, but this results in higher wholesale prices of dairy products. The higher Canadian prices make it difficult for the Canadian dairy market to compete internationally.

Per capita consumption of butter in Canada and population growth have put pressure on butter availability.  When butterfat is removed from milk the resulting skimmed milk or skimmed milk powder has a very limited market outside of Canada.  Because Canada has good transportation and available refrigeration, there is very little consumer demand for skimmed milk powder in Canada. The only solution for excess skimmed milk is to dispose of it.  Because dumping skimmed milk is not economically attractive, this is rarely done.  Therefore, limited amounts of butter are allowed to be imported into Canada.  The U.S. is the closest source.

As Canada enters into world markets with more trade agreements, some of the barriers to dairy imports will be weakened.  The possible renegotiation of NAFTA could also have an impact. Because U.S. butter is higher priced, the U.S. butter market may have to compete with lower international prices in future sales to Canada.

Mexico is the second largest buyer of U.S. butter.  As will be shown below, they are also the second largest seller of butter to the U.S.


The low level of butter exports has continued for the last two years.  For the prior years 2007 to 2014, exports were much more robust as U.S. butter was priced at international market prices. 


Imports of butter have remained in a tight range for the last 10 months of 2016, continuing at the 2015 levels.  The only real difference between 2015 and 2016 is that 2015 started off with low exports following huge imports in December 2014.  From March to December, 2015 and 2016 were exports were closely matched.


Butter imports are coming mostly from three countries, Ireland, Mexico, and New Zealand.  Why is so much butter going back and forth across the U.S./Mexico border?  Butter in Mexico is less expensive than in the U.S.  Butter is a relatively high cost product in Mexico diets, so vegetable oils are often used in place of butter, keeping butter consumption lower.  Butter can also be imported into Mexico from other countries at low international prices.  Therefore, the best Mexican strategy is often to export Mexican butter to the U.S. which is allowed via the NAFTA program.


There is now a four year trend of increased butter imports to the U.S.   While they have not reached the record levels of 2004 and 2005, if these trends continue, new record imports could occur.


As a result, net exports of butter remain negative, meaning that the U.S. is a net butter importer.  The net imports expanded in 2016, not so much a result of exports which increased slightly, but because imports increased more than exports.


NDM is the largest U.S. dairy export item by volume.  NDM is the basis of Class IV and Class II milk prices and can also be used for setting Class I prices.  For the last four months of 2016, export volumes were at record levels.


This allowed the U.S. to squeak out a record setting volume of NDM exports in 2016.


However, prices were half of the prices received in 2014.  The U.S. has remained aggressive in NDM pricing competing successfully against the EU and New Zealand.


Imports of NDM have been at or near record levels for every month in 2016.   The main suppliers of NDM to the U.S. are New Zealand and Canada.  The reason for the high level of NDM imports from Canada was covered above.  New Zealand imports were based on favorable pricing.


Overall, net exports of NDM were below prior years.  The increased levels of exports at the end of 2016 were outmatched by the increased levels of imports.  While record levels of exports were "squeaked out," record levels of imports hit strong record levels.


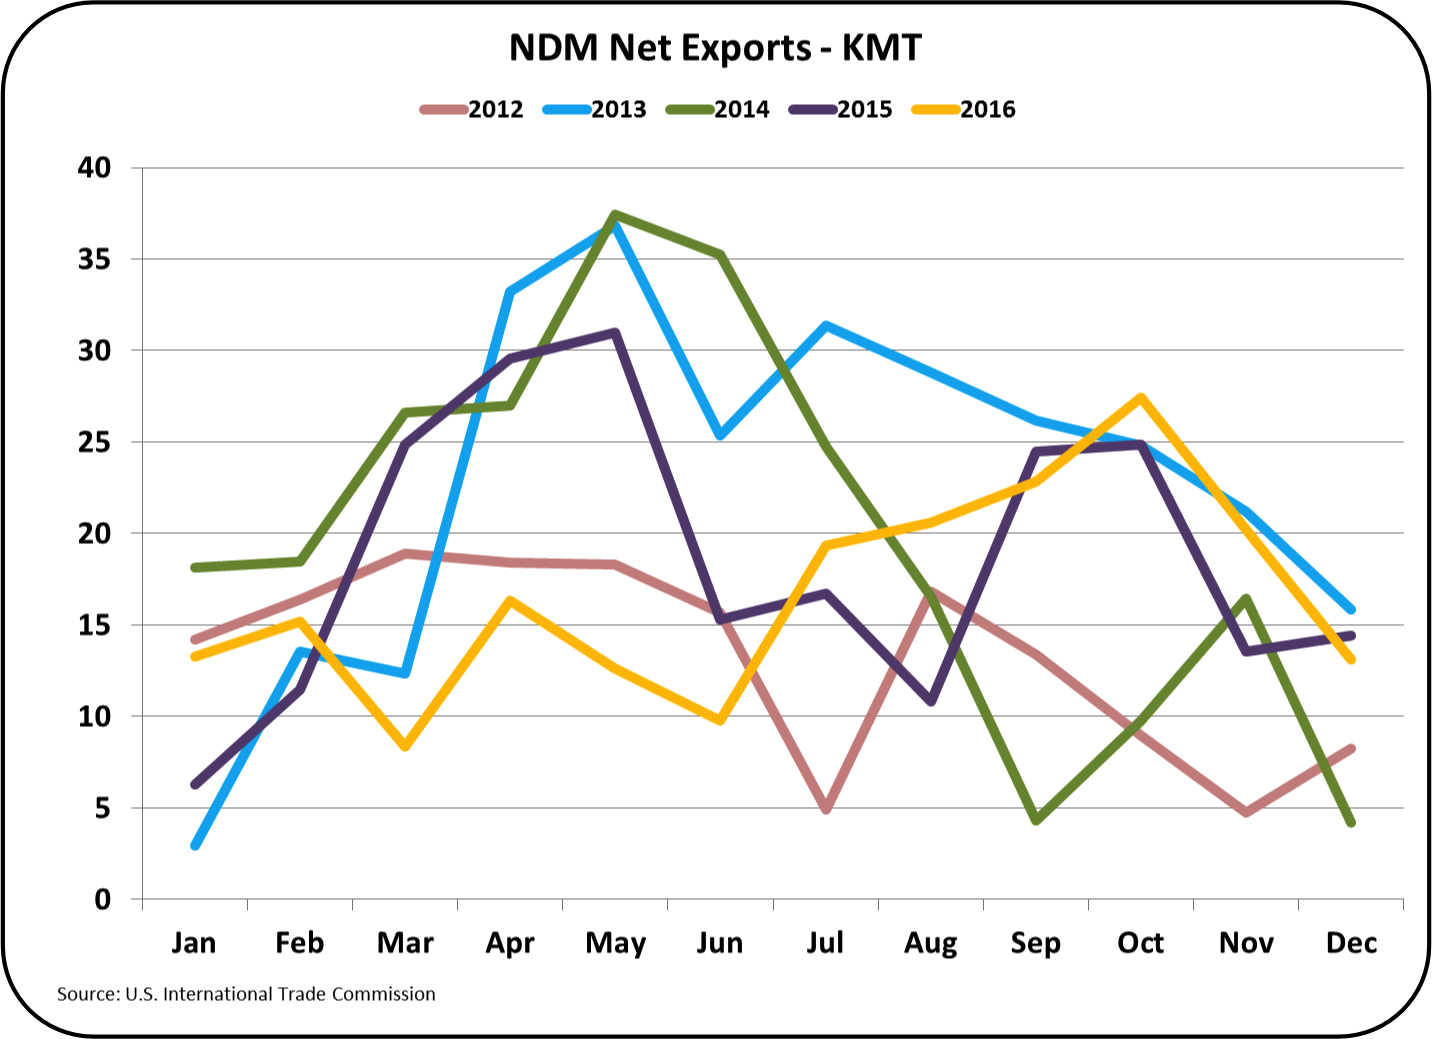
This did result in the fourth straight year of declines in the net exports of NDM.  Since 2013, net exports of NDM have declined in volume by more than 25%.


This post and the prior post provided an overview of exports and imports for the four commodities used to price producer milk in the U.S.  Considering the global oversupply and low prices, exports did well.  However, the increased volumes of dairy imports did offset the export efforts.

If TPP had been approved, all protection from imports including the two-tiered tariff and quota program would have been eliminated (see prior post).  With a strong USD and global overproduction, imports might have increased well above the 2016 levels.

The dairy export/import market could be volatile in 2017 as new approaches to international trade are discussed and new trade agreements implemented.  Those events will continue to be covered in the blog.

Sunday, February 19, 2017

2016 U.S. Dairy Exports and Imports - Part One

Analytics for U.S. 2016 exports and imports of dairy products are now available.  The results were mixed.  By some statistics, exports were at record levels.  By other statistics, net exports were off for most of the dairy commodities used to price producer milk.  This post will cover primarily cheese, because cheese demand and its influence on the price of cheese is by far the most important analytic in determining producer milk prices.  (See this prior post to see why cheese is the most important commodity, by far.)

Cheese exports, in metric tons, have increased in the last nine months.  By December, exports were above the prior two years.  This certainly shows a healthy trend.


Where did these exports go?  Mexico is by far the best market for U.S. cheese accounting for about 30% of U.S. exports.  Mexico imports were near 2015 levels, but most other importing countries were lower.  The lower imports of U.S. produce cheese were caused by lower prices from Oceania and Europe.


During 2016, imports have risen even faster than exports.  In December imports were near record levels.


The imports came from a lot of different countries with big increases over 2015 coming from Ireland and Mexico.  With the Mexican peso continuing to fall against the USD, and with NAFTA providing open borders, cheese imports in 2017 could continue to have very strong growth.  Could cheese production increasingly cross the border like automobile production has?  See the September18, 2016 post for a review of free trade agreements.


In total, net exports (exports minus imports) of cheese were flat.  If net exports remain flat, they will make up a decreasing percentage of U.S. cheese production.


Cheese pricing hit a 2016 high in August, and has declined somewhat since then.  The NASS price of cheese has not fallen as much as the export price of cheese, but as the USD gains strength versus other currencies, and inventories grow (see prior post) the U.S. price of cheese may show some decline.  To date, the futures market is showing a slight increase in cheese prices in 2017.

In reviewing full year analytics, the U.S. became a net exporter of cheese in 2010. Net cheese exports reached a high in 2014, and have taken significant declines in 2015 and 2016.


Cheese exports increased nicely from 2000 to 2014, but have since decreased. The creeping rise in imports shown in the second chart may be the start of a trend.  In the past, a lot of the cheese imports have been specialty cheeses primarily from France and Italy.  The U.S. is now seeing imports of commodity cheeses from other sources.


The chart below is another view of the export/import relationship for cheese.  As the line for exports declines, and the line for imports grows, the net difference begins to close.   If the lines meet, there are zero net exports.  After significant gains from 2005 to 2014, the gap has closed significantly in 2015 and 2016.  Cheese exports as a percentage of production decreased to 5.2% in 2016, compared to 6% in 2014.  In 2016, 368 KMT were exported vs. 317 KMT in 2016, a decline of 51 KMT.  However, U.S. production of cheese has continued to grow and inventories are growing (See the  February 7, 2017 post).


Whey is a co-product of cheese manufacturing.   Some of the whey is dried which makes it a suitable product for shipping and export.  In 2016, 44% of dry whey was exported, up from 41% in 2015. The volume of dry whey exported increased for 172 KMT in 2015 to 192 KMT in 2016.  The increase was lead by significant increases in exports to China.   Dry whey prices have increased in 2016 beginning at $.24 per lb. and ending the year at $.40 per lb.  January 2017 pricing continued to climb to $.44 per lb.  The dry whey price is the basis for pricing Other Solids in the component pricing formulas and this increase is a significant boost for the Class III milk price.  There is very little dry whey imported into the U.S.


Exports of cheese and dry whey in 2016 were on an upward movement.  The increase in cheese imports is troubling for the U.S. dairy industry.  Butter and NDM 2016 exports and imports will be covered in a upcoming post to this blog.  

The other impactful change in the U.S. dairy industry is the possible acceptance of the USDA proposal to make California a Federal Milk Marketing Order (See the February 12 post to this blog for more details).  A meeting with producers and other interested parties will be held on February 22. Following the February 22 meeting, additional information will covered in this blog.

Sunday, February 12, 2017

California as a FMMO - Addendum added February 14

For years, there has been discussion of California becoming a Federal Milk Marketing Order.   In the last few years, this has become a serious proposition with procedures and definitions developed to change California's milk payment system to a Federal Milk Marketing Order based on the component payment process.  That would make about 75% of U.S. milk payment based on the FMMO component payment system,  In 2017, the USDA will probably finalize acceptable language and a vote will be taken of the milk producers in California, which will likely pass.  Implementation will commence immediately but it will take time to finalize the transition.


How will this impact California?  How will California's new status impact the rest of the U.S. dairy sector?  How might this impact the U.S.'s status in the global markets?

In this post, some of the highlights of the conversion will be covered, and the potential impact of the change will be discussed.

The differences between the California payment system and the Federal Order payment system were reviewed in my March 2016 article in Progressive Dairyman.  Some of the differences will be eliminated if California becomes a Federal Order, but others will remain.  One of the really big changes is that there will be a specific payment for milk protein.  Today there is only payment for "solids not fat" and butterfat.

Although the motivation for California to become a Federal Milk Marketing Order is primarily to improve producer milk prices, the change will bring other significant changes.  California is unique in its huge production of nonfat dry milk and skimmed milk powder, much of which is exported.  In 2015, 32% of California's milk went to these powdered products.  Another 44% went to cheese production. Skimmed milk powder and cheese both require high levels of milk protein.


Under the current California payment system, payment was for "Solids not fat," which means that lactose, a low value component, and milk protein, a high value component, were valued equally.  The California payment system did not provide a strong incentive for higher levels of milk protein.  However, certain California cheese producers do pay an incentive for protein on top of the California minimum payment.  But the change to a system that always provides a constant incentive for milk protein should stimulate producers to review genetics, nutrition and other practices to maximize protein in the milk.

The chart below shows the major cheese producing states.  Wisconsin is the largest cheese producer with over 80% of their milk going to cheese.  California is the second largest cheese producer.  Many producers in Wisconsin not only receive specific payment for milk protein through the Federal Order pricing, but also receive bonus payments for high levels of milk protein.  If California changes to a Federal Order payment system, it will help level the playing field for cheese production.


One of the unique parts of the California payment system is the existence of "quota." which enjoys a premium while "over quota" does not enjoy a premium.  It is a very big factor as the payment for milk covered by "owning quota" amounts to about $12 million per month.  There is an active market in the sale and purchase of "quota" and many producers have paid a lot of money to buy "quota." If the transition eliminated quota payments it would insure defeat of the change to a Federal Order.  As a result, the most likely final language will include a process by which, milk over quota will be charged a penalty, and the money generated form that will be used to pay the bonus for milk covered by quota.

One of the common factors for the six existing Federal Orders that pay on components is the Producer Price Differential (PPD).  The Producer Price Differential is calculated as the difference between the Uniform milk price (a weighted average of the four Classes in the Order) and the Class III price less a few expenses.  Orders with a higher percentage of Class I milk, which has a higher value, will typically get a larger PPD.  Because California has a lot of lower priced Class IV milk, and very little Class I milk, the PPD will be small and sometimes negative.  Perhaps for that reason, the PPD as proposed for California would be uniquely used as an adjustment to the component prices of protein, fat, and other solids.

For more details on the impact of conversion of California to a Federal Milk Order, see my recent article in Progressive Dairyman.

ADDENDUM

On February 14, 2017. the USDA announced the details of the findings and the conclusions reached.  They are available publicly at this link.   The conclusions reached which will be presented to producers for approval are at the bottom of this length document.  Questions on the document will be answered at a meeting in Clovis, California on February 22.  Some significant changes from the information above were made in areas such as the PPD.

The cover letter accompanying this announcement can viewed at this link.

Additional details will be provided in future posts to this blog.

Tuesday, February 7, 2017

January Prices Mixed


January 2017 Class and Component milk prices were announced on February 1.  The Class III price was down 3.6% to $16.77/cwt.  The decline was the result of a drop in cheese prices as inventories increased.  Butter, NDM, and dry whey prices increased.  However, the increases in three of the four commodities that determine milk prices were not enough to outweigh the dominance of the drop in cheese prices.  (See this blog post for an analytical explanation of the cheese price/ Class III price relationship.)


Component price changes were more dramatic.  Butterfat increased in value by 8.1%, Other Solids increased in value by 21.3%, but milk protein dropped by 19.1%.  The drop in the price of milk protein resulted from both the decreased price of cheese and the increased price of butter.  As shown in the chart below, both components that make up the formula for pricing milk protein had a negative influence in January.


This has shifted the financial contribution of milk protein and butterfat.  Butterfat is now contributing 53% to the Class III milk price.  Milk protein is now contributing a lower value making up 39% of the Class III price.  To compare this to the prior month, refer to the January 8 post to this blog.


This has also influenced the long-term trends.  Butterfat is now worth more at $2.53/lb. compared to milk protein at $2.18/lb.  Other Solids continued its gain reaching $.25/lb., a higher price than seen in all of 2016.  The price of other solids is based on the price of dry whey, which is primarily an export item.  More data on this is covered later in this post.


The increased butter price is influencing the above trends.  The butter price chart shown below has five years of data.  While butter is again over $2/lb. it is still far from the peak prices reached in 2014 and 2015.  The price of butter has seen a gradual increase starting in 2010.  Initially this looked more like a normal fluctuation, not a trend.  However it is now clearly a trend, increasing from around $1.50/lb. in 2014 to around $2.00/lb. in 2016/7.  If consumer consumption of butter continues to grow, butter prices will likely continue this increase.


A review of inventory levels does raise some concern.  Inventories of cheese rose in December after four months of declines as shown in the chart below.


Cheese inventories do increase with the long-term trend of increased U.S. per capita consumption of cheese and population growth.  Cheese exports grew significantly since 2010, but declined starting in 2015.  The pace of production of production has increased steadily in spite of the decline of in exports.


The chart below shows that starting in 2015, as exports declined, cheese inventories have been above the normal growth trend line.  This is causing a bubble in inventories that is weighing on cheese prices.  This is especially concerning because the Class III milk price is extremely dependent on cheese prices.  Because of the longer shelf like of cheese vs. other dairy products, excess milk production can be temporally housed in cheese inventories.  However, as cheese inventories rise, prices do decline. 


Butter inventories are also increasing as shown in the year-to-year comparison below.  However, this increase is not out-of-line considering the increased per capita consumption.  Because U.S. butter prices are well above international butter prices, exports are nil.  


Production of butter has been on a decline for the last four years.  Imports of butter have been making up for the deficit.  More on this somewhat unusual situation will be covered in the next blog post when December export data is available.


Inventories of dry whey and nonfat dry milk, both major export items, have remained at appropriate levels.  Exports have remained strong and January 2017 prices for both products are will above 2016 prices.  As mentioned above, dry whey is the basis for other solids pricing. The current price is well well below 2012 to 2014 pricing, but is increasing.  There is an interesting article in the current dairy exporter blog, citing the increased global demand for whey protein.  Dry whey does have a reputation for being a good source of dairy protein.  However, whey protein represents only about 18% of the protein in milk, with the rest going into cheese.  Dry whey is primarily lactose.


Nonfat dry milk exports have remained very strong.  Pricing has been poor, but it is increasing.  As a result, inventories have remained at very acceptable levels.


While exports of dry whey and NDM remain strong, there is concern that the very strong USD will keep prices below the high levels seen in prior years.  More will be examined on this in the next post that will cover dairy exports for the full year of 2016.