January 2017 Class and Component milk prices were
announced on February 1. The Class III price was down 3.6% to $16.77/cwt.
The decline was the result of a drop in cheese prices as inventories
increased. Butter, NDM, and dry whey prices increased. However, the
increases in three of the four commodities that determine milk prices were not
enough to outweigh the dominance of the drop in cheese prices. (See this blog post for an
analytical explanation of the cheese price/ Class III price relationship.)
Component price changes were more dramatic.
Butterfat increased in value by 8.1%, Other Solids increased in value by
21.3%, but milk protein dropped by 19.1%. The drop in the price of milk
protein resulted from both the decreased price of cheese and the increased
price of butter. As shown in the chart below, both components that make
up the formula for pricing milk protein had a negative influence in January.
This has shifted the financial contribution of
milk protein and butterfat. Butterfat is now contributing 53% to the
Class III milk price. Milk protein is now contributing a lower value
making up 39% of the Class III price. To compare this to the prior month,
refer to the January 8 post to this blog.
This has also influenced the long-term trends.
Butterfat is now worth more at $2.53/lb. compared to milk protein at
$2.18/lb. Other Solids continued its gain reaching $.25/lb., a higher
price than seen in all of 2016. The price of other solids is based on the
price of dry whey, which is primarily an export item. More data on this
is covered later in this post.
The increased butter price is influencing the
above trends. The butter price chart shown below has five years of data.
While butter is again over $2/lb. it is still far from the peak prices
reached in 2014 and 2015. The price of butter has seen a gradual increase
starting in 2010. Initially this looked more like a normal fluctuation,
not a trend. However it is now clearly a trend, increasing from around
$1.50/lb. in 2014 to around $2.00/lb. in 2016/7. If consumer consumption
of butter continues to grow, butter prices will likely continue this increase.
A review of inventory levels does raise some
concern. Inventories of cheese rose in December after four months of
declines as shown in the chart below.
Cheese inventories do increase with the
long-term trend of increased U.S. per capita consumption of cheese and population growth.
Cheese exports grew significantly since 2010, but declined starting in
2015. The pace of production of production has increased steadily in
spite of the decline of in exports.
The chart below shows that starting in 2015, as
exports declined, cheese inventories have been above the normal growth trend line.
This is causing a bubble in inventories that is weighing on cheese
prices. This is especially concerning because the Class III milk price is
extremely dependent on cheese prices. Because of the longer shelf like of
cheese vs. other dairy products, excess milk production can be temporally
housed in cheese inventories. However, as cheese inventories rise, prices do decline.
Butter inventories are also increasing as shown
in the year-to-year comparison below. However, this increase is not out-of-line
considering the increased per capita consumption. Because U.S. butter
prices are well above international butter prices, exports are nil.
Production of butter has been on a decline for
the last four years. Imports of butter have been making up for the
deficit. More on this somewhat unusual situation will be covered in the
next blog post when December export data is available.
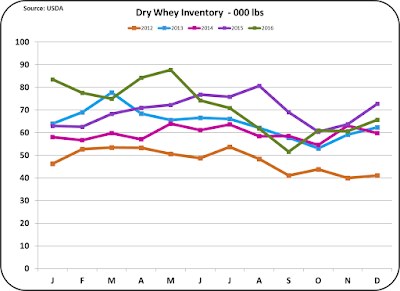
Inventories of dry whey and nonfat dry milk,
both major export items, have remained at appropriate levels. Exports
have remained strong and January 2017 prices for both products are will above
2016 prices. As mentioned above, dry whey is the basis for other solids
pricing. The current price is well well below 2012 to 2014 pricing, but is
increasing. There is an interesting article in the current dairy exporter blog, citing
the increased global demand for whey protein. Dry whey does have a
reputation for being a good source of dairy protein. However, whey
protein represents only about 18% of the protein in milk, with the rest going
into cheese. Dry whey is primarily lactose.
Nonfat dry milk exports have remained very
strong. Pricing has been poor, but it is increasing. As a result,
inventories have remained at very acceptable levels.
While exports of dry whey and NDM remain strong,
there is concern that the very strong USD will keep prices below the high
levels seen in prior years. More will be examined on this in the next
post that will cover dairy exports for the full year of 2016.


No comments:
Post a Comment