Friday, April 28, 2023

Producer Milk Prices are Down, but Retail Prices have not Followed.

The U.S. CPI has come down with March showing .1% overall inflation month to month.  That brought the overall 12-month index to 5%.  That is still well above the desired 2% annual level.  In the December 2022 post, retail price inflation for food was at 10.9%, well above the overall inflation rate of 7.7%.  Where do the dairy products stand now?  Have they reduced their prices or at least not increased prices?  Three major dairy products are reviewed below; whole milk. Cheddar cheese, and butter.  The retail prices will be compared to the wholesale prices, which are the basis of producer milk prices.

The wholesale prices, as calculated by the Agricultural Marketing Services (AMS) show a significant price reduction.  The retail prices from the Bureau of Labor Statistics (BLS) are flat. 

The three products below do show a leveling of retail pricing, but no reductions.  The AMS prices for whole milk and butter do show significant price drops. 

WHOLE MILK

Milk for drinking saw a near 50% retail price increase beginning in 2019, and ending in mid 2022 (Chart I).  Since then, retail milk prices have remained stable between $4.10 and $4.20 per gallon. The retail inflation has stopped in fluid milk prices, but there is still no deflation. 

By comparison, the Class I fluid milk prices paid to producers fell by 24% from its May 2022 peak of $2.22 per gallon to $1.68 per gallon in March 2023 (Chart I).  The skim AMS price is based on a mixture of Class III and Class IV prices.  AMS milk prices are usually quoted as a price per cwt.  To allow a comparison with the BLS, the AMS prices have been converted to price per gallon at 8.6 pounds per gallon.
Chart I - Prices of Class I milk and its retail price
The spread between the retail and wholesale price of milk is shown in Chart II.  The spread has grown significantly, with wholesale prices declining and retail prices remaining stable.  The spread has grown by over 50% since 2019.  Processors, logistics, and retailers have seen a huge revenue increase.
Chart II - The Spread of Pricing Between Retail and
Wholesale Prices of Whole Milk
So where will fluid milk prices go from here? As mentioned above, the AMS price of skim fluid milk is calculated based on Class III and Class IV pricing.  Class IV skim milk pricing is based on nonfat dry milk which is an export product, and the international prices will go wherever international events takes them.  The Class III skim price is primarily based on the price of domestic Cheddar cheese.  Cheese prices were on an upward trend in 2021 but are on a downward trend in 2022. lowering the price paid for Class I milk. 

So far, the lower prices paid to producers for milk have not lowered retail prices.

CHEESE

The spread between retail and wholesale prices of cheddar cheese are big.  The prices used in Chart III by BLS and AMS are based on Cheddar cheese only.  The prices show that producer milk makes only about ⅓ of the total consumer retail price for cheese.  Cheese making, delivery, packaging, and marketing make up the rest.  Similar to whole milk, the retail price continues to maintain its price, while the wholesale price has dropped.

Chart IV plots the spread for the years 2014 through 2023.  It varies by $1 per pound with a lot of volatility.  In 2022 cheese retail prices increased to a high while AMS prices were flat to down
Chart III - Cheddar Cheese Retail and Wholesale Pricing

Chart IV - The Spread Between Retail and Wholesale
Prices of Cheddar Cheese
BUTTER

Butter prices have had wild swings.  In 2022, the retail price of butter increased by 40%, from $3.47 per pound to $4.88 per pound.  Wholesale prices of butter increased by 48% over the same time span.  The wholesale price has dropped from its high in October 2022 to March 2023 by $.77 per pound, a 24% drop.  The wholesale price of butter is falling quickly with adequate supplies of butter, but this has not materially changed the retail price.
Chart V - The Retail and Wholesale Prices of Butter. 
The spread between the wholesale and retail prices (Chart VI), shows an increase of 128% in just one year.  When will the extreme volatility slow down?   
Chart VI - The Spread between Wholesale and
 Retail Prices of Butter
The retail changes in butter prices will soon find further price reduction as new lower cost butter replaces the current butter on the grocery shelves.  Will the retail price of butter come down to the 2021 levels?  If so, butter will have to go through a deflation cycle.

 SUMMARY

These three dairy products make up the majority of U.S. milk production.  The COVID policies implemented in 2020 did have a major influence on disrupting the U.S. dairy business from milk producers to processors and to retail sales.  Then inflation came in to further disrupt the dairy business.  With volatility comes more concerns that can slow down any industry.   

Have dairy products contributed to the lower CPI overall?  It may lower the CPI but will prices return to 2021 prices?  There seems to be enough spread between wholesale and retail to lower the retail price of dairy products.


Sunday, April 16, 2023

Is De-pooling from Federal Orders Growing?

This post will cover de-pooling in the three largest Federal Orders, the Upper Midwest, California, and the Southwest.  In the Upper Midwest, an estimate of de-pooled milk is included in their monthly statement.  In the California and the Southwest Federal Orders, the amount of de-pooling was estimated by comparing the volume of milk produced and the amount marketed through the Federal Orders.  Most of the milk produced within a Federal Order is processed in that Federal Order and this calculation provides a reasonable estimate of de-pooling.

De-pooling does not make more money.  It only moves money around with the de-pooling party getting more money and others getting less.  Who is the main looser?  Class I milk, because it cannot be de-pooled.  Who else may be on the loosing end?  Once milk is de-pooled it is not protected by the Federal Order minimum pricing and may be getting a lower price than the pricing in the Federal Order.

The three Federal Orders reviewed below have some very consistent patterns.

  • Starting in early 2020, huge amounts of milk was de-pooled.
  • There were huge negative producer price differentials in 2020 as COVID policies upset the balance of supply and demand.
  • None of these three federal Orders had any negative producer price differentials (PPDs) in 2022.
  • The established patterns of all three of these Federal Orders is to de-pool all Class III or Class IV when they are the highest paid of the four Classes of milk.

The Upper Midwest is primarily focused on Class III milk for cheese.  Class III monthly milk volume makes up to 90% of the Upper Midwest milk.  In 2020 and the first half of 2021, 77% of the total Upper Midwest milk was de-pooled (Chart I).  

Chart II shows the dip in pooled Class III milk as up to 3000 million pounds of milk per month were de-pooled in the Upper Midwest Order.  During this time Class III milk was priced at over $20 per cwt. and PPDs were consistently negative.  Chart III shows the course of the PPD over the last 10 years.  The disruption caused by COVID now appears to be healed.  For all of 2022 and into 2023, the PPDs have all been positive.

In 2020 and 2021, most of the Class III milk was de-pooled to avoid the payment of a negative PPD (Chart III).  

Chart I - Pooling and de-pooling in the
Upper Midwest Federal Order 
Chart II - Upper Midwest Class III Milk
Chart III - Upper Midwest PPD

California has been a Federal Order since November 2018. Beginning with the first month as a Federal Order there has been de-pooling of close to 50% of California producer milk.  Charts V and VI below show the similarity in volume of Class III and Class IV California milk.  Both Class III and Class IV when not de-pooled account for 1400 million pounds per month.  One or the other has been heavily de-pooled in California on a consistent basis since it became a Federal Order.  Under the California system, no de-pooling was allowed.  In 2023 de-pooling has dropped to around 30% as both Class III and Class IV milk prices fell. 
Chart IV - California Milk Included and Excluded
from the Federal Order.
Chart V - Volume of Class III Milk Pooled in the
California Federal Order.
Chart VI - Volume of Class IV Milk Pooled in the
California Federal Order
Chart VII - California PPD

The Southwest Federal Order is growing fast and will likely become the third largest Federal Order in 2023.  The Southwest Order has a decent balance between Class III and Class IV milk.  Class III milk peaked at 761 million pounds a month in 2022 and Class IV milk peaked at 521 million pounds in 2022.  Charts IX and X below show a mirror image for de-pooling.  When Class III is the highest paid, it is de-pooled and when Class IV is the highest paid, it is de-pooled.  In both cases, the de-pooling is nearly total.

In 2020 and 2021, de-pooling accounted for 48% of the Southwest milk and in 2022 it accounted for 42%.  In 2022, most of the de-pooling was Class IV which is a smaller volume than Class III and therefore less milk has been de-pooled.  So far in 2023, de-pooling has averaged 38%.

Chart VIII - Southwest Federal Order Milk Included and
Excluded from the Federal Order.
Chart IX - Volume of Class III Milk Pooled in the
Southwest Federal Order.
Chart X - Volume of Class IIVMilk Pooled in the
Southwest Federal Order.
Chart XI - Southwest PPD

Overall, de-pooling has become a tool regularly used every month.  The de-pooling does diminish the presence of the Federal Orders and makes milk pricing less visible. 

The good news is that the massive pricing swings that occurred with COVID policies has now been eliminated.

Tuesday, April 4, 2023

Excellent News for Cheese and Butter Exports

Dairy exports help create demand for dairy products.  This post explores the 2022 exports compared to the prior years and compares exports to domestic production for the four commodities used to price producer milk: cheese, butter, nonfat dry milk (NDM), and dry whey.  

Tables I & II put a perspective on the size of these exports.  The largest export volume of these commodities is NDM/skimmed milk powder (SMP) followed by dry whey.  These are really the byproducts of butter and cheese production.  The export of cheese and butter are much smaller than their byproducts.  Exporting NDM/SMP and dry whey do not increase the amount of milk needed from dairy producers, but the export market does provides a way to sell the byproducts at a decent price.  Increasing exports of cheese and butter does expand dairy milk production.

Table I - Exports of Key Dairy Products
Table II compares the exports to domestic production.  Butter exports reached 9% of production in 2022 and concluded the year with a positive net exports (exports exceeded imports) which has not been the case in recent history.  Cheese exports also grew significantly reaching 7%.
Table II - Exports Compared to Production

CHEESE

Cheese exports are doing very well with a 10% growth in 2022 (Chart I).  Chart II shows the six largest importing countries.  They all increased purchases in 2022 over 2021.  Mexico is the largest importer of cheese and Chart III shows their significant growth in 2022.  Mexico increased imports by 16% in 2022 over the prior year.

Cheese production is the biggest use of domestic milk.  Exports of cheese can have a major impact on growing the U.S dairy industry. 
Chart I - U.S. Cheese Exports
Chart II - Largest Cheese Importing Countries
Chart III -  Cheese Imports to Mexico

BUTTER

Butter also saw significant growth in exports (Chart IV).  Overall, butter exports increased by 44%, a very major accomplishment.

Out of the top five largest importers (Chart V), four saw significant growth in imports.  Canada doubled their butter imports in 2022, Mexico quadrupled their imports, Bahrain increased business by 38%, and South Korea more than doubled their imports (Charts VI and VII).

This is also a very positive accomplish, again increasing business for producers and processors.

Chart IV - U.S. Butter Exports 
Chart V - Largest Butter Importing Countries
Chart VI - Butter Exports to Canada
Chart VII - Butter Exports to Mexico
NDM/SMP

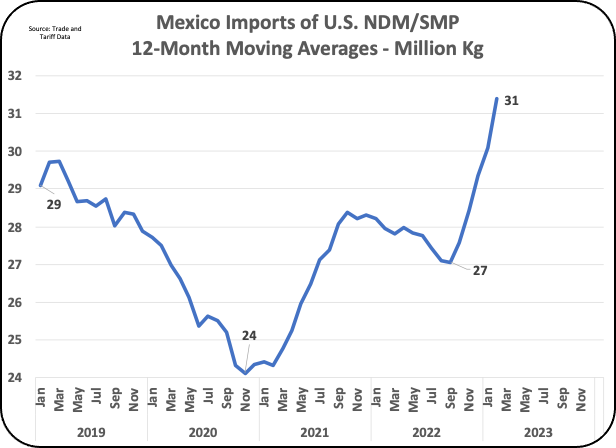
Exports of NDM/SMP declined in 2022 (Chart VIII).  Mexico is the largest importer of NDM/SMP and Mexico increased the volume of imports by 7% over the prior year (Chart X).  The Philippines, Indonesia, and China finished at volumes close to the prior year (Chart IX).  However other buyers like Vietnam dropped U.S. imports by half.  As covered in the prior post, NDM/SMP prices have fallen with heavy competition.  With very low international prices and other competitors anxious to sell, the growth of U.S. exports may be slow.  In 2022, 73% of NDM/SMP was exported.

NDM/SMP has a good shelf life and is a byproduct of butter churning.
Chart VIII - U.S. Exports of NDM/SMP
Chart IX - Largest NDM/SMP Importing Countries
Chart X - NDM/SMP Exports tp Mexico
DRY WHEY

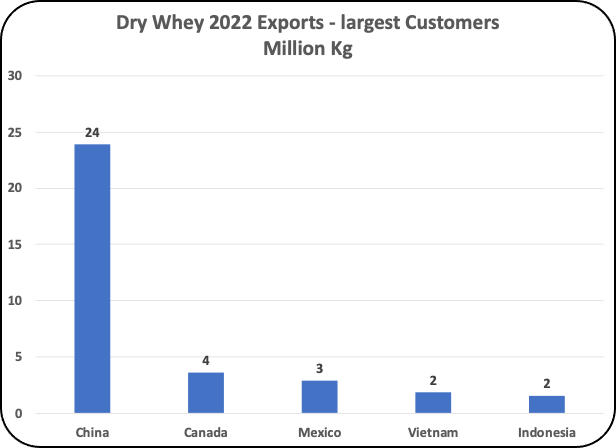
Dry whey export data can be confusing.  The USDA definition uses strict limitations for dry whey and does not include modified dry whey products.  Other sources include modified whey like whey permeate (whey with no whey proteins).  The market for whey permeate is huge in the international markets.  It is typically used in feeding swine. Mixing whey permeate with feed for swine can improve eating and weight gain.  China is a huge importer of whey permeate. The charts below include regular dry whey and modified dry whey products.  The definition used by the USDEC does include modified whey products.

Charts XII and XIII show the huge and growing Chinese market for whey permeate.

Chart XI - U.S. Exports of Dry Whey
Chart XII - Largest Dry Whey Importing Countries
Chart XIII - Dry Whey Exports to China

 SUMMARY

The gains in exports of cheese and butter are exciting to build on.  Future gains can make exports a major source of demand for U.S. dairy products.  

Finding a lucrative home for the NDM and dry whey byproducts can improve dairy revenue.  However, selling on the international markets can be volatile and disrupt supply and demand.  With that, prices can be volitive.