Sunday, October 18, 2015

Exports in Trouble - Imports Expand

The August dairy export data showed what was expected - lower exports. Especially important was the huge drop in cheese exports, down 14.3% vs. the prior month and down 28% vs. the same month in 2014.  This is very important because U.S. dairy prices are closely linked to cheese prices.  Inventories of natural cheese and American cheese are ballooning as analyzed in the prior post and will negatively impact U.S. wholesale cheese prices.


While imports of cheese were down as shown in the chart below, that change did not come close to offsetting the drop in cheese exports.  Butter imports were up again.  The prior post provides details on what appears to be a building bubble in butter pricing.


CHEESE

In the chart below, year-by-year comparative levels of cheese exports are graphed.  A strong downward trend has been established over the last six months.  This will likely continue as the factors causing the decline are still in place.  Most of the losses come from the three biggest export customers, Mexico, South Korea, and Japan.


Cheese imports, although less than the prior month, are still way above historical levels.  Cheese processors are discovering more low cost sources of cheese and are taking advantage of them.


Where are these imports coming from?  They're coming from everywhere as many sources offer lower cost alternatives.  The major growing import country is New Zealand.  Taking advantage of import opportunities is how a capitalistic society works.


With 17 KMT of cheese imported in August and 23 KMT exported, the net exports amounted to only 6 KMT. This has erased the progress made in the prior four years.


As shown in the prior post, cheese inventories are on the rise as cheese production outstrips demand.

BUTTER

The butter price was described in the prior post as a bubble.  Will the bubble burst?  In August, butter imports increased 11.5%.   Butter inventories have remained stable as reviewed in the prior post.  Bubbles occur when there is a basic change in how the industry conducts business and this is the case for butter.  Butter churning has been decreasing for the last three years after decades of growth.  Exports are almost nonexistent.   Butter imports are well above historical levels.   Because consumption is growing, as the U.S. production declines, imports will continue to grow to meet the demand.  Because butter is much less expensive internationally than in the U.S., if nothing changes, the U.S. butter price bubble will burst.  The only question is when.


Who is supplying this imported butter?  As shown in the chart below, Mexico is the by far the largest source and a new import player.  Also, Australia and Canada are new sources.  Butter imports from Ireland, New Zealand, and France are not new, but they are significantly expanded.


Primarily due to escalating imports, the U.S. is now a net butter importer.


NONFAT DRY MILK AND DRY WHEY

The final two commodities that determine milk prices are nonfat dry milk and dry sweet whey.  Like cheese and butter, exports of these items are also off.  NDM exports did make a slight improvement over the prior month, but YTD exports are off 6%.  NDM is the basis for pricing Class IV milk. 


Dry whey exports are off 18% YTD and have been at or below the prior year for all of 2015.   Dry whey is primarily an export item and the lack of exports has reduced the price considerably.  The Dry whey price is the basis for pricing "other solids" in the component pricing Federal Orders.


EXCHANGE RATES

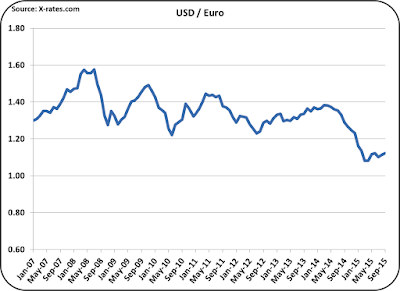
Exchange rates continue to make exports difficult.  Europe's economy continues to slowly improve. The USD/Euro exchange has now stabilized and is showing signs of a strengthening Euro.  However, for now, exchange rates do give the huge European dairy industry a pricing advantage.


U.S. imports from New Zealand have increased dramatically.  Fonterra, the sales and marketing cooperative of the New Zealand dairy industry has been very effective in promoting New Zealand's dairy products.  Fonterra has offices around the world including offices and labs in the U.S.  Recently, due to the aggressive growth program supported by Fonterra investments, their credit rating has been downgraded.  Regardless, Fonterra is a strong force to be reckoned with internationally.  Shown below is the exchange rate between the USD and the NZD.  The USD continues to strengthen relatively making the prices for New Zealand dairy products lower on the international markets.


Mexico is the largest importer of U.S. dairy products.  The NAFTA agreement prevents unfair tariffs and unfair limitations of movement of dairy products between the U.S. and Mexico.  Mexico has a cheese deficiency and is by far the U.S.'s best customer for cheese.  However, exchange rates are increasingly making U.S. dairy products more expensive in Mexico and are making Mexican produced dairy products less costly to import.  Mexico does have alternatives sources for unbranded dairy products.


Little seems to be happening that could change the export/import picture in the short term.  For this reason, U.S. dairy prices are more likely to fall than rise in the next six months.

Sunday, October 4, 2015

Butter Bubble

September 2015 Class and Component Prices show significant component pricing volatility.  The Class III milk price was down only 2.8% to $15.82/cwt. on relatively stable cheese prices.  However, the volatility of prices for butterfat and milk protein was very large, with protein down 22.9% and butterfat up 21.4%.  This was driven by a huge increase in butter prices, which were already at high prices.  Other Solids become almost worthless with a 59.6% plunge to five cents per pound.


This has really changed the pie chart of component pricing as shown below.  Butterfat contributed 61% of the value to the September Class III price.


These prices vary significantly from the long-term trends with butterfat becoming significantly more valuable than milk protein.  Butterfat was valued at $2.75/lb. and milk protein was valued at $1.98/lb.


The high price for butterfat was based on a spike in butter prices to $2.44/lb.  The chart below shows the relationship between butter and butterfat prices.  The futures market is currently showing butter prices at $2.57/lb. for October.  If this figure holds, it would drive butterfat prices to $3.33/lb., the second highest price every recorded.


The very high butter price has driven the milk protein price down to $1.98/lb., which is one of the lowest prices seen in the last ten years.  The price of milk protein is driven by two factors; the price of cheese and the price of butter.  As cheese goes up in price, the price of milk protein goes up, but the price of butter has an inverse relationship.  As the price of butter goes up, the price of milk protein goes down.  This formula gives value to milk protein for increasing its value because butterfat is typically more valuable in cheese than in the form of butter.  For the first time since 2001, butterfat is currently worth more in the form of butter than cheese as shown in the chart below.


WHAT IS DRIVING THIS?

The current U.S. price for butter is nearly twice the international price.  As mentioned in the prior post, the U.S. has become a net butter importer as imports are outweighing exports.  Also, over the last three years, butter churning has been decreasing.


This has kept butter inventories in line, but there is no inventory scarcity that would typically increase prices to record levels.  


With all these facts in mind, it seems inevitable that butter prices will take a tumble very soon.  The futures market is showing a 20% drop by year-end 2015.

CHEESE

What is the good news?  The most important parameter for the Class III milk price is the price of cheese.  At least for now, the price of cheese is holding.  


However, as reviewed in the prior post, the U.S. is beginning to see cheese imports increase as less expensive cheese blocks and barrels are available on the international markets.  Significant new imports are coming from New Zealand.

This is impacting inventories.  And, as the inventories rise, price deterioration begins.


The futures market is not showing any weakness at this time with stable cheese prices predicted for the next year.  This also seems unreasonable as the underlying factors; the Russian embargo on dairy products, lower China dairy purchases, exchange rates, and lifting of the European dairy quotas, show no suggestion of changing.  Production of cheese continues to expand in the U.S., but the current rates of growth in production exceeds expected increases in domestic disappearance.  YTD, cheese production is up 2.5% over 2014 and for the month of September production was up 3.5% over the prior year.


As reviewed in the prior post, cheese exports are down considerably and cheese imports are at record levels for this time of the year.  With no change in direction of these analytics, inventories can expect to rise and prices drop.

OTHER SOLIDS

Other solids are valued based on the price of dry whey.  Dry whey is an export item.  In posts through 2013/4, other solids were identified as a new source of revenue for the dairy producer.  Today, other solids are essentially worthless.  Other solids were delivering $2 to $3 dollars to the class III price.  In September they delivered $.26.  The cost to dry whey and package it removes what value there is for dry sweet whey.  Improved pricing for dry whey will probably be slow and minimal, as global conditions will not quickly change. 

CONCLUSIONS

The items reviewed above include a price bubble for butter, a potential drop in cheese prices, and a sustained lower value for other solids.  The most important item for the Class III milk price is the cheese price.  Efforts to help maintain the value of the Class III price should focus on cheese.  All aspects from production, exports, imports, and domestic consumption can influence the domestic U.S. supply/demand forces.