
The Class III price is strongly related to the cheese price which also fell 5%. Milk Protein fell 9.9% because cheese prices fell 5% and butter prices rose 3%. Click for an explanation of this relationship.

Current and future prices for Class III milk are all in the $17/cwt range. How bad is this? By historical standards, it is not so bad. As compared to the highs of $20/cwt, $17 seems like quite a drop. But, compared to pricing over the last 12 years, current prices are reasonably healthy. The cost of feeds has certainly made profitability a challenge at $17/cwt, but current prices are "OK" from a historical perspective.

The most valuable part of milk is the protein. Payment for protein at the USDA standard level of 3%, made up 51% of the milk check. If protein percent were higher, the payment would be greater. The key to maximizing the milk check is to maximize milk protein. Every .1% increase in milk protein is worth an additional $.33/cwt while every .1% change in milk fat is worth $.16/cwt. For research findings on the latest technologies for maximizing protein and components, please refer to Dr. Daniel Luchini's blog.

The chart below shows the 13 year trends for milk protein, milk fat, and Other Solids. Other Solids pricing was stable at $.45/lb, the new normal.

Cheese prices remain the primary driver of Class III milk prices. Domestic consumption of cheese increases steadily and is very predictable. However, cheese exports are not so predictable. They are influenced by many factors in the world market for cheeses. In the CHEESE section below there is an analysis of where the U.S. stands in exports of cheese as compared to other major dairy producing countries.
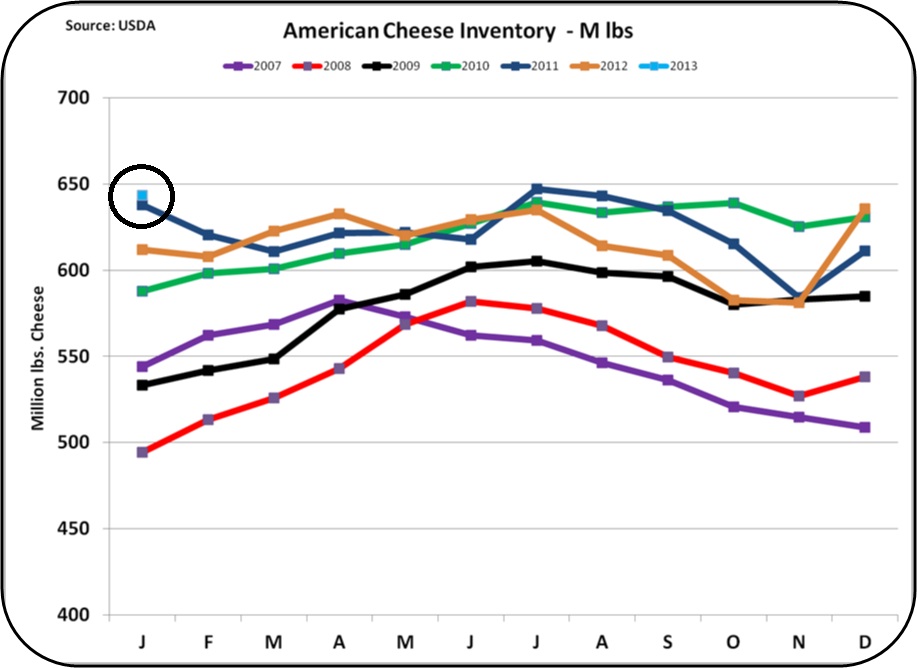
CHEESE
Cheese inventories remained near record highs at the end of January 2013 (see the circled values below). The high inventory levels came about sharply at the end of 2012 and continue to remain high. These stocks must be depleted before milk prices can improve. The major culprit for the increase is exports that will be analyzed in some detail below.

December 2012 cheese exports were a record for the month of December. December 2012 is the most recent export data available. However, December exports were down nearly 25% from their May high. There is no cyclical pattern to cheese exports, so the decrease is not a normal annual rhythm. It is a decrease caused by adverse business conditions in the global markets.

The chart below expresses the same export data in a continuous form, so the increases in exports over the last 5 years are more visible. The U.S. has made good progress in expanding exports of cheese and however, there is a significant opportunity to grow exports much further.
The growth has occurred in an up and down pattern of volatility. From May to September, the largest drop in the history of cheese exports occurred. No wonder cheese inventories are bloated.

The U.S. is the largest and fastest growing cheese manufacturer in the world. There is no other country that is even close to the U.S. in tons of cheese manufactured. Well over 90% of this is consumed domestically. However, domestic consumption is still well below that of the Eastern European countries, so additional increases in domestic consumption can be expected.

However, as compared to other dairy exporting countries, the U.S. is far behind in exports. Data for the chart below is available only through 2010, but even with the U.S. growth in 2011 and 2012, the U.S. is still not getting the volume of cheese exports that it should achieve on the world market.

Exports of cheese are made up of commodity cheeses and specialty manufactured and branded cheeses. The latter category is more profitable and less price sensitive to world events. Commodity cheeses (eg. blocks or barrels of cheddar cheese) are more subject to volatility because the same cheese is manufactured in other parts of the world and all sources must compete on a price basis. With changes in exchange rates as well as global swings in milk production and consumer demand, exports of commodity cheeses are very volatile. The large U.S. exports of commodity cheeses leaves the U.S. open to significant volatility.
BUTTER
Butter inventories are also higher than normal. This is adversely impacting butter and butterfat prices.

Butter per capita consumption has been stable for years and the population growth is the only driver of increased consumption; so the factors that come into play are production and exports. A look at the charts for production and exports makes the reasons for high inventories obvious. Butter production has continued to grow, and exports are not growing.


There is only one solution for this problem - lower prices for butter and butterfat. With lower prices, production will decrease and exports will increase. The demand for Nonfat Dry Milk is driving butterfat availability, but lower prices are inevitable.
OTHER SOLIDS
Other Solids continue to be the bright spot in component demand and pricing. Other Solids pricing is based on the value of whey, and whey demand continues to put pressure on the available supply.

The increased value of Other Solids continues to be a nice contributor to milk revenue. Other Solids is contributing an extra $2.50/cwt to the Class III price, where in the past, the contribution has been insignificant.
WHERE ARE PRICES GOING?
Until excess inventories are depleted, there is no hope for higher dairy prices. As explained above, there is little hope for an improvement in butterfat prices. Increased exports of cheese are critical and the Dairy Export Council continues to provide good support for exports.
On the milk supply side, as long as feed costs are high, there will probably be no explosion of milk production.
Clearly, cheese exports are the short and long term solution.