Sunday, February 25, 2024

More on Low Protein Prices

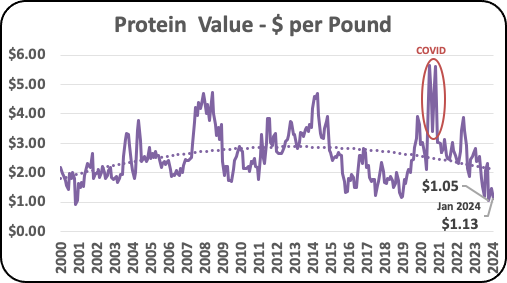
In the prior post, information and charts were used to show why milk protein values are low and will likely stay low.  Milk protein pricing is based on butterfat and Cheddar cheese prices.  Butterfat is high priced and cheese is low priced.  Based in the USDA formulas, milk protein was valued at only $1.13 per pound.  Readers asked many questions about where milk protein prices are going and what other factors are influencing them.  This post will cover some of the issues and questions.

  • When could milk protein value become negative if the current trends continue?
  • Are wholesale cheese and butter inventories influencing prices?
  • What is the impact of increasing component levels?
PROTEIN LEVELS MAY HAVE NO VALUE IF THE TRENDS CONTINUE.

In the prior post the following statement was published. "It is possible that with an increasing price for butter and a stable price for cheese, the value of milk protein could go negative based on the current FMMO formula for protein."  How long would it take for this to happen?  Currently, milk protein is at $1.13 per pound.  If cheese prices remained around their current price of $1.52 per pound, and butterfat continued its long-term trend and reached an average of $3.50 per pound, milk protein would be priced at $.58 per pound.  Butterfat was priced at $3.71 per pound in October 2023.  If butterfat reached $4.00 per pound, milk protein would be worthless.

By the current long-term trend lines, butterfat could reach an average of $3.50 per pound in five years and could reach an average price of $4.00 per pound in 10 years.

THE INFLUENCE OF WHOLESALE INVENTORIES ON BUTTERFAT AND PROTEIN PRICES.

Butterfat is priced based on the wholesale price of butter.  Are low inventories of butter causing high prices?  Butter reached a high level of production in 2020 and 2021 during the COVID years.  Since then, production has dropped and then recovered to a level of 176 million pounds per month (Chart I).

Chart I - Production of Butter

The increase in butter production did cause inventories to swell in 2020 and 2021 as shown in Chart II.  However, by the end of 2023, inventory levels had returned to reasonable levels around 287 million pounds.  This level of inventory should not be pushing butter prices higher.

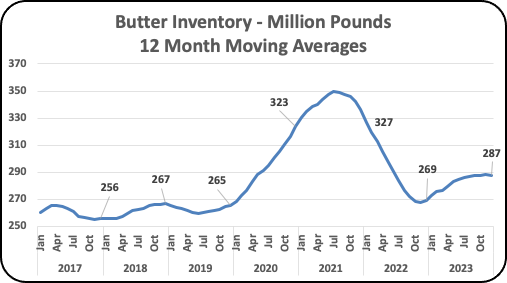
Chart II - Butter Inventory

With the high inventory levels in 2020 and 2021, butter prices did fall to $1.51 per pound. In 2022 and 2023 inventory levels fell and butter prices went up (Chart III).  What is surprising is that the inventories never fell to the level of 2017 to 2019. but the price of butter hit record levels.  Butter inventories are not causing the record high butter prices.

Chart III - Wholesale Price of Butter
The wholesale cheese price is used by the Agricultural Marketing Service (AMS) to partially price milk protein and is based on Cheddar cheese only.   Inventory levels are not made public.  However, Cheddar makes up the majority of American cheese  and that data is available publicly and will be used in the charts below.  Over the course of the last three years, Cheddar production made up 70% of American cheese production with a range of 68% to 76% per month.

Chart IV shows the production of American cheese which has increased in 2021 and then leveled off in 2023.
Chart IV - Production of American Cheese
American cheese inventories (Chart V) have been flat for the last two years, meaning that cheese inventory prices should be stable, and they are.
Chart V - Inventory of American Cheese
With lower inventories in 2020, the wholesale price of Cheddar cheese did increase.  In 2022 and 2023 inventories were flat, and cheese prices returned to historic levels (Chart VI).  There was no correlation between the consistent level of cheese inventories and the fall in cheese prices.  There is minimal influences between cheese inventories and cheese prices.

Chart VI - Wholesale Price of Cheddar Cheese

THE IMPACT OF CHANGING COMPONENT LEVELS.

How are the U.S. milk producers surviving?  Charts VII and VIII show the difference between the AMS index price for butterfat and milk protein and the average price based on actual component levels.  In the last six years, the average revenue increased as components grew.  The higher component levels increased average producer revenue by $1.60 per cwt.

Chart VII - Values of Butterfat and Milk Protein using AMS
Index Component Levels vs. Actual Levels of Components
Chart VIII - The Difference per Cwt. Using Standard vs.
Actual Component Levels 

WHAT DOES THIS DATA SHOW?

The change in the prices of cheese and butter are only partially influenced by wholesale inventory levels of butter and cheese.  Regardless of the inventory levels, the escalation of butter prices and the stable prices of cheese are long-term.  The low protein prices result primarily from the protein formula as covered in the prior post.

Other factors also come into play that can influence butterfat pricing.  

  • There is less fluid milk from which some butterfat is removed.  
  • Cheese volumes have grown and now consume more than half of the U.S. milk produced and thereby consume more than half of the U.S. butterfat.  
  • Per Capita Consumption of butter was lower in 2022 as retail prices escalated. 
  • ...........

Tuesday, February 13, 2024

Butterfat Prices are High and Protein Prices are Low. When Will it Change?


Butterfat has become the most important component in milk pricing.  In January 2024, the value of butterfat made up nearly 70% of the FMMO Class III price.  Is this a short-term event or will this pricing pattern continue?  This post will review long-term component pricing trends and other factors impacting the current pricing.

Chart I below shows the breakdown of Class III pricing between butterfat and skim Class III milk.  The pricing during 2020 and 2022 are very different as the COVID "stay at home" policies were implemented and this period should be ignored in analyzing long-term trends.  Will butterfat continue to dominate producer milk pricing?  If so, producers should concentrate heavily on maximizing butterfat.
Chart I - Class II Price Split Between
Butterfat and Skim Milk

BUTTERFAT AND PROTEIN PRICES

The long-term prices of butterfat and milk protein are shown in Charts II and III.  The butterfat price (Chart II) shows a steady increase over the last 24 years.  In analyzing the trend, the 2020 to 2022 prices influenced by COVID should be ignored.  With that in mind, the current high butterfat prices are just a continuance of the long-term pricing trends.  With an established 24-year trend, it is likely that the same trend will continue.  Therefore, increasingly high butterfat prices will likely continue.
Chart II - Butterfat Price Long-Term
Protein prices (Chart III) have fallen to a near record low of $1.05 per pound in October 2023.  The only time protein was priced that low was in late 2000.  In January 2024 protein was $1.13 per pound.  The trend line shows a rising price from 2000 to 2015 and then lower prices (ignoring the COVID years).  The current trend for protein prices is an eight year pattern of low prices.

Chart III Protein Price Long-Term

THE FMMO FORMULA FOR MILK PROTEIN AND THE PRICES FOR CHEESE AND BUTTER

One of the reasons for the low protein prices is the FMMO formula for protein.  Milk protein is priced based on the AMS wholesale cheese price minus the wholesale butter price.  The protein formula is shown below in its full format, and then simplified in the second formula below.  Milk protein pricing is based on the wholesale prices of only two commodities, cheese and butter.  When the cheese prices go up, the value of milk protein goes up.  When the butter prices go up, the value of milk protein goes down.

The formula below represents the formula used by the FMMO. The formula listed in the FMMO statement shows that for January 2024 the protein price would be $1.83 if it was based only on the cheese price.  However, the second part of the formula is the adjustment for butterfat which is a negative $.70 resulting in the published protein price of $1.13

Protein Price = ((Cheese Price – 0.2003) x 1.383) 
+ ((((Cheese Price – 0.2003) x 1.572) – Butterfat Price x 0.9) x 1.17) 

Protein Price for January = $1.83 - $.70 = $1.13
______________________________________________

The FMMO formula can be simplified and maintains the identical price.

Milk Protein = 3.2 x Cheese Price - 1.1 x Butterfat Price - $.65

Milk Protein for January 2024 = $4.91 - $3.13 - $.65 = $1.13

The long-term AMS cheese prices show a leveling trend (Chart IV).  While there was growth from 2000 to 2015, after that cheese prices leveled off.  In January 2024, the price was at $1.52 per pound.
Chart IV - Wholesale Cheese Price Long-Term 
The AMS wholesale butterfat price used in the protein formula is shown in Chart II above.  The current January 2024 price per pound is very close to the long-term trend line.  As mentioned above, the butterfat price has consistently escalated over 24 years and is currently very close to its long-term trend line at $2.98 per pound, almost twice the cheese value.

WHAT WILL THE FUTURE BRING?

Based on the long-term trends for cheese and butter. it is likely that the cheese prices will remain low and butter prices will continue to increase.  That would create a lower protein price based on the current FMMO formulas.

Is the milk protein price formula out-of-date?  While there is nothing included in the IDFA recommended changes, this formula should be re-evaluated.  It was originally developed to show that butterfat is worth more in cheese than in butter, but that situation has drastically changed.  Butterfat is now worth more in butter than in cheese.  

It is possible that with an increasing price for butter and a stable price for cheese, the value of milk protein could go negative based on the current FMMO formula for protein.  As a side note, while the price of butterfat is based on the price of butter, which made sense in 2000, but most of the butterfat today goes to cheese, not butter.

THE IMPACT ON CLASS III vs. CLASS IV PRICES

In January 2024, Class IV milk was priced at $19.39 per cwt. while Class III milk was priced at $14.71 per cwt., a $3.68  per cwt. spread.  Both have the same value for butterfat, but Class IV skim was at a much higher price than Class III skim.  Class III skim was at $4.92 per cwt., while Class IV skim was at $9.30 per cwt.

Is this because the NDM, an export product, was increasing in value?  No, the NDM price used to price Class IV skim milk is at a very normal level of $1.21 per pound (Chart VI).  The cheese/butterfat adjustment part of the FMMO Class III protein price formula shown above is the cause of the huge difference in skim milk prices.  
Chart VI - Wholesale NDM Price Long-Term

With the current FMMO formulas, butterfat will continue to be high priced and milk protein will be low priced.  The "make allow" recommended by the IDFA will only make this spread greater.


Sunday, February 4, 2024

What Happens if the "Make Allowance" Changes Proposed by IDFA are implemented?


The International Dairy Foods Association (IDFA) has suggested major changes to the pricing of producer milk.  The most impactful part is a major change in the "make allowances" in the Federal Order formulas.  The make allowances were changed three times in 2007 and 2008.  Those changes were analyzed in a post to this blog in August 2009.  The 2009 blog is worth reading. 

When the "make allowances" are increased it simply moves revenue from producers to processors.  Producers are already struggling with low prices.  This proposed change in the "make allowances" will further reduce producer revenue.  The IDFA proposed changes would be implemented over four years.  The impact would lower the Class III prices by $1.62 per cwt.  

The formulas for pricing producer milk are based on the wholesale prices of dairy commodities.  As an example, the formula for pricing butterfat is shown below.  The butterfat "make allowance" is currently $.1715 per pound.  The "make allowance" represents the price per pound to churn butterfat into butter.  As the "make allowance" increases, it reduces the price paid to producers for butterfat.  The producer is paid less for his butterfat, and processors get a larger margin for churning.

Butterfat Price = (Butter Price – 0.1715) x 1.211 

The proposed changes in "make allowances" are shown in Table I.

Table I - Proposed Make Allowance Changes to
Federal Order Formulas

The analysis in Table II uses the January 2024 wholesale values of commodities in the current column and lists the milk component values that would be calculated using the proposed "make allowance" changes listed in Table I

The value of milk protein paid to producers would decrease from $1.13 per pound to $.99 per pound, a 12% decrease (Table III).  The producer value of other solids would decrease by 50% and nonfat solids would decrease by 10%.  Butterfat would decrease by only 4% as churning is a small element in changing butterfat to butter.

Table II - Component Prices with proposed
Make Allowance Changes
Table III - Percent Change in Component Prices
with Proposed Make Allowance
Butterfat has made up most of the producer revenue in 2023.  Milk protein prices have fallen in 2023.  With the change in "make allowances", butterfat would be worth $2.85 per pound and protein would be worth $.99 per pound (Table II above).  Butterfat would then be worth 288% more than protein.  This would provide a major incentive for producers to increase butterfat with a minor incentive to increase milk protein needed for cheese making.

How would this change in "make allowances" impact the Class III milk price?  Class III milk is the majority of producer milk.  The data in Chart IV is calculated based on the Class III index published monthly by Agricultural Marketing Service (AMS).  The index is calculated using 3.1% protein in skim milk and 3.5% butterfat in total milk.  

The line titled "current component levels" uses 3.4% protein in skim milk and 4.1% butterfat in total milk.  The calculation is based on 2023 component levels, which best represents the current financial impact on producer payments.  By the fourth year, the price of Class III milk would be reduced by $1.62 per cwt.
Chart IV - Value of Class III milk per cwt.
Table V - Changes in Class III Milk Price
Who is the IDFA that is proposing the changes in make allowances?

The International Dairy Foods Association is located in Washington, D.C. and represents the nation's dairy manufacturing and marketing industry.  They do not represent producers.