Wednesday, March 23, 2016

How is Producer Milk Priced in the U.S.?

U.S. Milk Payment Systems

Many of the emails and conversations that come from this blog concern the mathematics and inter-relationships of the U.S. producer milk payment systems.  Over the course of the last year I have authored four articles for Progressive Dairyman reviewing these payment systems.  Links to the four articles are listed below.

"Producer milk payment systems in the U.S."  - June 11, 2015

"How the FMMO's component payment system works"  - September 11, 2015

"The Federal Milk Market Order's advanced payment system" - December 10, 2015

"California vs. FMMO milk pricing" - March 11, 2016


________________________________________

March 2016 Reviews of Current Milk Pricing Dynamics 

For the most current posts on February producer prices and January exports and imports, use the links below.

"February Dairy Prices Show Little Change" - March 9, 2016

"Decreased Exports and Increased Imports Reduce Demand for U.S. Produced Dairy Products"- March 17, 2016

Tuesday, March 15, 2016

Decreased Exports and Increased Imports Reduce Demand for U.S. Produced Dairy Products

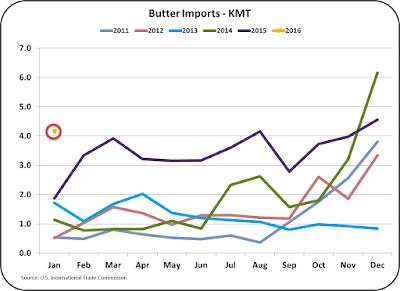
Decreased exports and increased imports are significantly reducing demand for U.S. produced dairy products.  Cheese exports are down 8% in January, a six-year low, and cheese imports are at record levels for the month of January.  Nonfat dry milk exports were up slightly for the month of January, but so were imports, resulting in lower net exports.  Butter imports were also at a six-year high for January.  When imports are up, some of the domestic demand for these dairy commodities is being satisfied with imports, reducing the demand for U.S. produced dairy commodities.

Cheese is always the most important dairy commodity for pricing producer milk.  In January, cheese exports were are 2013 levels, a three year low for this month.


Cheese imports were above the prior five years by a significant amount.  The sources of the imports are shown later in this post.


The result is that cheese net exports were below the last five years as shown below.  The prior post showed the impact on U.S. cheese inventories that continue to build.  With larger inventories of this perishable product, prices will continue to decline.


Imports of cheese are coming from many countries, some new sources and some expanded sources.  The largest new source is New Zealand, followed by Australia, Denmark, Ireland, and Nicaragua.  Obviously U.S. cheese buyers are finding many sources of lower priced cheese on the international markets.

Cheese exports are down to all major importing countries except Mexico.  The largest loss by far is South Korea.


As mentioned in the prior post, cheese production must be reduced to keep cheese inventories in line.  If they are not, NASS cheese prices and the Class III milk price will continue to decline.

Butter imports continue to increase, up significantly for the month of January.  This has kept the U.S. as a net importer of butter (imports are greater than exports.)  Imports are currently 5% of total U.S. butter consumption.


Butter is being imported primarily from Mexico.  U.S. produced butter is much higher priced than Mexican butter.  Additional increased imports are likely.


 Nonfat dry milk exports were up slightly in January, but so were imports.  The net result is a four-year low in net exports of nonfat dry milk.  The price is also very low, keeping Class IV milk prices very low.  Nonfat dry milk is still the largest export dairy product for the U.S.


Exchange rates are one of the big culprits in making U.S. dairy products unattractively priced on the international markets. Below are the exchange rates between the U.S. and its major international dairy trading partners.  Europe and New Zealand are major dairy exporting countries and Mexico is the U.S.'s largest dairy importing country.


Versus historical exchange rates, all show a 20% or more drop.  This simply means that U.S. dairy commodities are 20% more expensive than previously based strictly on exchange rates.  It is difficult to compete with this large a spread.  The U.S. continues to recover well from the 2008/9 financial crisis while much of the rest of the world continues to struggle.  A strong USD can be a point of pride, but it can also make exporting difficult.  

CONCLUSION

International conditions are causing low U.S. exports and high imports of the dairy commodities, cheese, butter, nonfat dry milk, and dry sweet whey.  In turn, they are forcing domestic prices lower for these commodities.  Lower prices for these commodities result in lower producer milk prices.  There is no short term reason to expect this situation to change.  The most critical is cheese.  Cheese production continues at a pace supported by a higher level of exports than currently exists.  There is no clear sign that production of cheese will decrease.  As long as these conditions continue, producer prices will not increase and may decrease further.

Wednesday, March 9, 2016

February Dairy Prices Show Little Change

Class and Component prices for February were released on March 2.  There were only minor changes from the prior month.  Butter increased slightly, cheese fell very slightly, and dry whey increased about 5%.  The increase in the dry whey price, up 5%, drove the value of other solids to a big percentage change, but a big percentage change from a prior price near "0" means very little.


As a result, the value of components show very little change from the prior month.  Milk protein is well below the long term trend and butterfat remains at a high value of $2.38/lb.


The most troubling statistics are the increasing inventory levels of cheese.  The January ending cheese inventories are shown below with the January end levels circled in red.  Increasing inventory levels result in decreasing cheese prices and decreasing cheese prices result in decreasing Class III prices.


The linkage in cheese prices and Class III milk prices is shown below.  There is a 96% correlation between the cheese price (as determined by NASS) and the Class III milk price.  A 96% correlation means that if one knows the cheese price, he can determine the Class III milk price with 96% accuracy.  The reason behind this is the mathematical relationship between cheese prices and Class III milk prices that was covered in a prior post.


Cheese production continues to run well above the prior year.  With a normal growth of both domestic and export volumes, this would be fine.  However, as covered in a prior post, cheese export volumes are well below the prior year and there is no immediate change expected.


A near term correction (reduction) in cheese production is needed in order to protect the Class III milk price.  The futures market is forecasting a relatively static Class III price in the $13/cwt. range through the middle of 2016, with minor increases after that.

There is little a producer can do to reduce cheese production except ride out the low prices and prepare for good component production as prices normalize.  The normalization should see a lower butterfat price, a higher protein price, and a higher Class III price.

WHOLE MILK POWDER

One other developing dynamic is the increase in Whole Milk Powder (WMP).  It is still small compared to Nonfat Dry Milk, but it is a rapidly growing and could be a significant dairy export product.  Internationally, the market for WMP is much bigger than the market for Nonfat Dry Milk.  However, in the past the U.S. has not participated in the WMP market, because there is only a very small market for WMP domestically.  That means that sales of WMP can be very volatile.

The chart below shows the increase in production which had doubled in the last eight years.   While still erratic, there is obvious growth.


In reviewing the year by year WMP production, 2016 appears to be off to a good start.  The growth is modest which should not bloat inventories, but is well above all prior years except 2015, where excess production did create an inventory bloat.

As of the end of January 2016, inventories are in control with no excesses to work out.


The WMP market represents a huge opportunity for the U.S.  It is a volatile market and entirely based on international opportunities.  WMP progress will be followed in this blog.