Tuesday, March 19, 2024

U.S. Milk Production is down. Which States have continued to grow?


There is a lot of concern about the decline in U.S. milk production.  Producer milk prices are low compared to prior years and many farmers are struggling to stay in business.  This post will cover where the lower milk production is occurring geographically and where milk per cow is growing or shrinking.  Increasing milk per cow has a financial benefit and the improvement in milk per cow has slipped in some regions.

U.S. MILK PRODUCTION

The first part of this post will cover the change in milk production as a percent change from the prior year.  Chart I illustrates the overall percent changes in the U.S. from the prior year.  Increasing milk production was positive through mid 2021.  Beyond that, there were more negative months than positive months.  The trend lines show a pattern of lower milk production in the U.S.  The charts below Chart I cover the changes in the major dairy states and are ranked by the current volume of milk production, largest to smallest.

Chart I - Percent Changes in U.S. Milk Production
vs. the Prior Year
California is the largest milk producing state.  The monthly decreases in milk production were spotty beginning in 2021 and by 2023 the monthly decreases have become regular.
Chart I - Percent Changes in California Milk Production
vs. the Prior Year
Wisconsin is the second largest milk producing state in the U.S.   Most of the. milk produced in Wisconsin is used in cheese production.  The decline of milk production began with slower but still positive increases starting in 2022.   For the last two years, Wisconsin milk production has only increased at about 1% annually (Chart II).
Chart II - Percent Changes in Wisconsin Milk Production
vs. the Prior Year
Idaho is the third largest milk producing state and is not in a Federal Order.  Idaho had significant growth in milk production in 2019 and 2020 and still maintains positive but with slower.growth through 2023.  The trend lines do show a steady decline in growth over the last five years (Chart III).
Chart III - Percent Changes in Idaho Milk Production
vs. the Prior Year
Texas, Chart IV, has a decline in the growth of milk production starting in 2021 and continuing to decrease to negative levels in 2023.  Most months in 2023 had lower milk production vs. the prior year.  This is a drastic change as Texas was the fasting growing milk producing state through 2022.
Chart IV - Percent Changes in Texas Milk Production
vs. the Prior Year
Michigan has maintained growth of milk production although there was a slowdown in 2022.  In 2023, most every month showed an increase in milk production vs. the prior year.  As will be covered in the second part of this post, Michigan has also showed a steady growth in milk production per cow which brings lower cost to milk production.
Chart V - Percent Changes in Michigan Milk Production
vs. the Prior Year
The charts above show a mixed impact of growth in milk production.  Michigan and Wisconsin have maintained growth but at a slower rate.  California has the fastest decline in milk production.

MILK PER COW

Milk per cow is an important parameter to follow as more milk per cow increases revenue per cow.  The U.S. enjoyed steady growth in milk per cow through 2022.  In 2023, that increase in milk per cow slowed (Chart VI).
Chart VI - U.S. Milk per Cow per Month
Michigan (Chart VII) remains the leader in milk per cow.  While the growth has slowed, it is sill mostly positive with an average of 2284 pounds per cow in January 2024.  Milk per cow peaked at 2295 pounds per month in March of 2023, well above any other state.
Chart VII - Michigan Milk per Cow per Month
Texas is also growing in milk per cow.  It is now ranked second with 2133 pounds per month average.  It also peaked in March 2023 with 2141 pounds per month.
Chart VI - Texas Milk per Cow per Month
Wisconsin has had continuous growth in milk per cow with an average of 2104 pounds per month in January 2024.  The Wisconsin gain in milk per cow is the most consistent of any state.
Chart VI I- Wisconsin Milk per Cow per Month
Idaho has had a very erratic path with milk per cow.  After peaking at 2115 pounds per month in March 2023, it has now fallen to 2082 pounds per month.  At its present level it is still the fourth best in milk per cow.  
Chart VIII- Idaho Milk per Cow per Month
California has also dropped milk per cow by 2% in the last year.  Its current milk per cow is 1983 pounds, 14% lower than Michigan.
Chart IX - California Milk per Cow per Month
Overall, U.S. milk production in the U.S has slowed to no growth or negative growth.  Growth in milk per cow continues in the U.S. but at slower gains.

Wisconsin has maintained the steadiest gain in milk per cow.  This is also consistent with their growth in milk volume.  Michigan has continued to lead the country in milk per cow.


Monday, March 11, 2024

2023 Butter and Cheese Exports are Down


n 2023 butter and cheese exports were down from 2022.  This post will cover some of the details behind these decreases.  Butter exports have always been minimal as the supply is limited.  Imports of butter are much bigger than exports and the butter imports are growing.  Cheese exports also grew in 2021 and 2022 but fell in 2023.  Mexico is now our biggest importer of cheese.

Data used in the charts below are the export and import quantities published by the USDA.  The USDA uses strictly butter while other sources may include butterfat and anhydrous (no moisture) butterfat. The USDA cheese export and import charts are based on American cheese as it contains 70% cheddar cheese which is used for producer pricing of cheese.

BUTTER EXPORTS AND IMPORTS

Butter exports had a significant jump in 2022 but fell in 2023.  The major difference was the increased exports of butter to Canada in 2023.  Canada has an ongoing shortage of butter and when available, butter is purchased from the U.S.  In 2022, retail butter prices in the U.S. increased significantly (see the prior post). and with that increase, retail butter sales decreased.  That made more butter available for exports and specifically butter exports to Canada. In 2023, butter exports to Canada increased by nearly 200%. 

In 2023, the retail price of butter declined and that increased U.S. retail sales.  Less butter was therefore available and exports to Canada dropped. At the end of 2023 exports to Canada were still above normal levels with an increase of 36% from the beginning of 2021.  Exports peaked at 7% of production and then fell to 3% by the end of 2023.

Chart I - Butter Exports

Butter imports continue to steadily increase (Chart II).  Over the three-year span in Chart II below imports increased by nearly 50%.  The major importer Ireland (think Kerrygold) which represents more than half of U.S. butter imports.  Imports of butter and butterfat from New Zealand are also growing, roughly doubling over the three-year span used in these charts.

Chart II - Butter Imports

Net exports are calculated by subtracting imports from exports. (Chart III).  The U.S. is a net importer of butter, and those imports are growing. They currently supplement U.S produced butter by 5%.
Chart III - Butter Net Exports

AMERICAN CHEESE EXPORTS AND IMPORTS

Cheese exports and imports in Charts IV through VI are based on American cheese only.  Cheddar cheese makes up 70% which is used to price producer milk is most of American cheese.

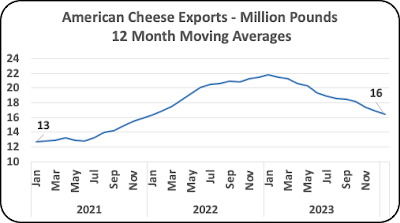
Cheese exports grew nicely in 2022 but fell in 2023.  Exports to Mexico have grown by 25% over the three-year span from 2021 to 2023.  Unfortunately, sales to South Korea and Japan fell. 
Chart IV - American Cheese Exports
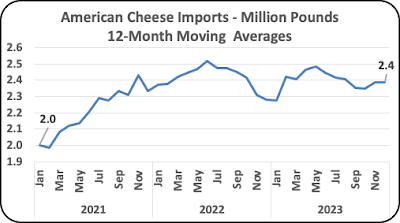
Imports of American cheese are small and currently represent less than 1% of the U.S. American cheese supply. 
Chart V - American Cheese Imports
That leaves a healthy amount of net American cheese exports equal to about 4% of U.S. production.
Chart VI - American Cheese Net Exports

At a time when domestic consumption is volatile, the changes in exports and imports add to the variability.  Dairy is always a volatile business. There are many things in the world that can rock global demand.  Events like COVID "stay at home" policies and inflation have further increased domestic volatility.  

Changes will be followed in future posts to this blog.

Sunday, March 3, 2024

What Dairy Products is the Consumer Buying?


The U.S. dairy industry is huge.  Including producers, processors, and retailers, dairy is a very big business.  In the end, the consumer satisfaction is key to success.  This post will cover retail pricing trends and consumer purchases of the major dairy products, butter, cheddar cheese, and fluid milk.  Fluid milk will be covered first as it has the largest price increases in the last five years.

Statistics for consumption of butter and cheddar cheese are not yet available for 2023.  The data used to mimic domestic consumption is represented here by disappearance from wholesale inventories.

FLUID MILK

Fluid milk sales have been steadily falling.  The rate of decline (Chart I) has been steady and continues to decline by about 2% annually. When COVID "stay at home" policies were implemented in early 2022 there was a short-term increase in fluid milk sales, likely caused by more cereal breakfasts.  With the passage of "stay at home policies", the rate of decline resumed. 

Chart I - U.S. Fluid Milk Retail Sales

Its often said that milk, especially for children, is a necessity and sales will not decrease with increasing prices.  The last five years has proven that correlation.  Prices of milk hit a record high in December 2022 with a price of $4.21 per gallon.  Since the beginning of 2019 to January 2024, the retail price of whole milk has increased by 36% (Chart II).  This has caused some tight budgeting for young growing families, but purchases have remained their long-term trends.  For the last year and a half, prices have leveled off at around $4.00 per gallon.

Chart II - Retail Prices of Whole Milk

BUTTER

Butter prices have reached new record highs.  Chart III follows the disappearance from wholesale inventories.  They tell an interesting story.  The year 2019 was normal with steady demand around 168 million pounds.  During the COVID years demand for butter increased to around 175 million pounds.  Then, in January 2023, the demand fell rapidly.  What made this happen?
Chart III - Butter Disappearance from
Wholesale Inventories. 
In 2022 butter prices escalated causing buyers to go to optional products like margarine (Chart IV).  The prices have since decreased a little and the volume of butter withdrawals from inventory have reached record volumes.  This could partially be a catchup from when prices were higher. 

The real puzzle is that currently the butter prices have remained very high.  Low inventories typically cause higher prices as covered in the prior post, but current butter inventories are not low.

Chart IV - Retail Butter Prices per Pound

CHEESE

Cheese withdrawals from inventory are steadily growing (Chart V).  There was some slowdown 
during the :"stay at home" policies but following that period volume growth continued at about 2% annually, the long-term trend.

Chart V - American Cheese Disappearance from
Wholesale Inventories

Wholesale cheddar cheese prices have followed demand as higher demand in late 2022 increased prices but with a slowdown in demand, the current price in January 2024 was at $5.72 per pound.
Chart VI - Retail price of Cheddar Cheese per Pound

COMPARISON TO PRODUCER PRICES

Below are the producer prices for the milk used for fluid milk, butter, and cheese.  The rate of inflation is for the last five years, the same as the retail prices above.

Comparing January 2019 to January 2024 there is a 28% increase in producer prices compared to the retail price increases of 36% for Fluid milk.
Chart VII - Class I Prices
Class IV milk prices have gone up by 28% compared to the retail butter price increase of 15% over five years.
Chart VII - Class IV Prices
Class III milk prices, the largest usage of producer milk, has gone up by 9%, almost identical to the retail price increase of cheese of 7% over five years.
Chart IX - Class III Milk Prices
SUMMARY

Producer price increases of cheese closely parallel the retail price increases for cheese.  However, fluid milk prices show a significant retail price increase well over the increase in producer milk prices.  Is the necessary purchase allowing higher retail prices?  Butter, which has a huge increase in producer prices reflects a much lower current price increase in retail sales.  When retail butter prices went to a record high of $4.88 per pound, sales dropped.  Did this cause retailers to lower prices?  With lower retail prices, disappearance from inventories shot up which could cause even higher producer prices.