Friday, July 31, 2009

July Class III Unchanged from June - USDA Announces Increase in Support Levels

When you're near the bottom, there isn't much further to fall! July Class III milk prices remained unchanged from June at $9.97/cwt.

Cheese and butter National Agricultural Statistical Service (NASS) prices declined only one penny, and dry whey prices increased slightly to offset the slight cheese and butter declines.


Chicago Mercantile Exchange (CME) cheese prices have increased a little in the last two weeks, but the NASS price runs about two weeks behind the CME prices (see April 2 post), so there was no relief in July.


The USDA announced today a program to increase support levels for cheese and nonfat dry milk to temporarily assist the dairy producers. Cheese support prices for cheddar blocks will be increased from $1.13 per pound to $1.31 and barrel prices will increase from $1.10 to $1.28. If nothing else changed, this would increase protein prices by $.58/lb and Class III milk prices by $1.73/cwt.

Other programs were announced in March, 2009 but they have had little immediate impact. The increase in support payments is scheduled to last through October, 2009.

Sunday, July 26, 2009

Low Cheese Prices have Nothing to do with the Poor Economic Times

In many previous posts to this blog, the formulas and historic pricing have been shown to firmly link dairy milk prices to cheese prices. Cheese prices are by far the most important variable in milk pricing. Milk prices are down because cheese prices are down. It has been suggested by some well known agricultural economists that the low cheese prices are, in part, caused by reduced consumer demand resulting from the current economic downturn. This absolutely is not true!

Below is a graph of per capita consumption of cheese in the U.S. with all recessions noted in blue. There appears to be NO correlation between cheese consumption and the state of the economy. Cheese consumption has been rising steadily for 37+ years and, while final statistics for 2008 have not been released, there is no reason to think that 2008 and 2009 will be any different than the long term trends.


Worldwide, cheese consumption continues to grow; but, toward the end of 2007, supply began outgrowing consumption. This over production continued through 2008 but is expected to slightly narrow in 2009.

The current "crisis" in the dairy industry has nothing to do with the hard economic times. It has everything to do with over production globally. The current cheese prices result from a 33% increase in New Zealand cheese production (see July 12 post) while the U.S. cheese production grew slightly more than normal (approximately 1% more than normal) due to favorable exchange rates and resulting exports.

The solution for the U.S. dairy industry cannot be controlled by programs only within the U.S. To have any long term impact on U.S. milk prices, programs are needed that recognize the global nature of the cheese prices.

Sunday, July 19, 2009

Who Dominates Butter Exports?

In the previous post, global movement of cheese was analyzed. New Zealand was shown to dominate the global market in cheese exports. The quantity currently produced and predicted to be produced are significant and will keep the world market supplied with relatively inexpensive cheese.

This post examines the same data for butter. All of this data, like the last post comes from the recently released report by the Organization for Economic Co-operation and Development (OECD) and the Food and Agriculture Organization of the United Nations (FAO). In the charts below, the major butter markets of the EU, the U.S., Australia and New Zealand are analyzed. On each chart the range of the scale is exactly the same (1000 kt) to help maintain a relative perspective.

Butter consumption and production in the U.S. are expected to be very close with no significant imports or exports. In 2008, with favorable currency rates, the U.S. became a butter exporter, however, in 2009 and thereafter, production and consumption are expected to be equal.

The European Union (EU), has been a net exporter, but by 2011, production will be reduced to only meet consumption.


Australia has been and will continue to be a net butter exporter. The amount of butter available for export is expected to be constant from 2004 to 2018.


New Zealand, who is the largest butter exporter today, is expected to increase exports significantly over the next ten years.


In fact, New Zealand will export all of the butter previously exported by the EU as well as pick up 100% of the global growth in butter imports of other countries.


Once again, the power of the New Zealand dairy industry can be seen. Cheese was analyzed in the July 12 post and the New Zealand dairy industry was analyzed in the May 7 post.

The health of the U.S. dairy industry is very dependent on the global dairy market. The New Zealand model of production and export deserves significant study as it's success will have major consequences on the US. Dairy markets.

Sunday, July 12, 2009

Global Dairy Predictions show U.S. Coming up Short

The Organization for Economic Co-operation and Development (OECD) and the Food and Agriculture Organization of the United Nations (FAO), just released their report covering the years from 2004 to 2018.

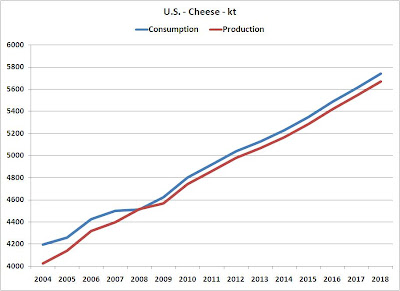
In reviewing the dairy data, it appears that there is very good news in the world for the dairy industry and cheese makers. Global demand for cheese is expected to grow very steadily for the next 10 years. The two big cheese makers, the EU and the U.S. have growing demand, but at a rate far less than the world in total. The U.S. should be in a position to take advantage of this to develop a strong export cheese business.


Unfortunately, the report concludes exactly the opposite! The U.S. had traditionally produced less cheese than is consumed and is therefore a net cheese importer. The exception to this was 2008 when the U.S. became a net cheese exporter.


Similarly, the 27 countries of the EU, while remaining a net cheese exporter, are actually predicted to export less cheese.


There is however, one country that is poised to significantly increase their exports. It is New Zealand. By 2018, they are expected to export 18 times as much cheese as they consume! After a few rough years in 2005 - 2008, the New Zealand dairy industry is expected to grow at an unprecedented rate.


By 2016, the small country of New Zealand is expected to surpass the 27 countries comprising the EU in cheese exports. The U.S., after a brief period of being a cheese exporter in 2008, will become increasingly a cheese importer. Yes, a lot of those imports will come from New Zealand.


Most of the efforts of programs like the Cooperatives Working Together (CWT) program to reduce cows in the U.S. and the "Got Milk" ads just don't seem to recognize and focus on the real issue which is the global dynamics of cheese production and consumption. More and more use of dairy is in cheese rather than fluid milk products and the Federal Milk Marketing Orders (FMMO) payment is all about cheese prices. Cheese has a good shelf life and density which makes it a global exportable/importable product.

In the May 7 post to this blog, the New Zealand Dairy Industry was analyzed. The real threat to the U.S. Dairy Industry is coming from New Zealand, not from the U.S. dairy producers or U.S. consumption of dairy products. To combat these threats, they must first be recognized. Today's programs do not recognize or address the real threats to the U.S. Dairy Industry.

Sunday, July 5, 2009

June Class III Component Prices Announced

June 2009 component prices were announced on July 2. The prices remained almost exactly at the previous months levels.


The changes from May to June were some of the smallest ever. Below is a table of the changes. Everything except Other Solids remained almost unchanged.

The Increase is Other Solids was the most significant change. Typically, Other Solids is not a major contributor to Class III prices. To understand the change, we need to review the factors that influence the pricing of Other Solids. The pricing of Other Solids is based on the Dry Whey price as calculated by the below formula. The cost to make dry whey (referred to as the make allowance and consisting of the drying, packaging, labor and overhead to make dry whey from wet whey) is subtracted from the Dry Whey price to calculate the raw material value and then multiplied by a factor representing the moisture content.

Other Solids = (Dry Whey price – 0.1991) times 1.03

Because Dry Whey prices have been near the make allowance, a small swing can have a big impact on the other solids price. Below is a table of the prices and changes in Cheese, Butter and Dry Whey. The increase in the value of Dry Whey was only 15.4%, but the formula calculation yielded at 115.2% increase in the value of Other Solids.


This unusual pricing scenario yielded an equally unusual pie chart of milk prices, with Other Solids taking a 15% share of the milk check.


In earlier posts the underlying movers of Class III pricing were shown to be positive. However, these changes will probably not begin to have an impact until near the end of 2009. They will be followed closely in future posts to this blog.