Sunday, December 13, 2015

Exports Continue Decline

Overall, exports continued their decline from the prior year and imports were up significantly.   On a solids basis, exports have dropped from 15.7% in 2014 to 14.3% of milk production through October 2015.  October exports were just 13.5% of U.S. milk production.   

Cheese exports were up slightly, but still below prior year levels.  Butter exports continue their drop from a very low base, as U.S. butter prices are nearly twice international prices.  NDM was up due to strong exports to Mexico, and dry whey continued its decline.


Imports were up across the board, helped by seasonal demand for butter and cheese and lower international prices for NDM and dry whey.. 


Exports to Mexico have been exceptionally strong, making up for some of the loses in other countries.  As has been mentioned many times in prior posts, cheese exports which significantly influence cheese inventories, are the most important element for Class III milk prices.

Cheese exports while still down from the prior year, are up slightly from the prior month.  Considering the difficult international market, this is a significant achievement.


If we look at the YTD shifts in cheese exports, only Mexico is up significantly.  Mexico has become by far, our strongest export destination for cheese.  While South Korea and Japan remain in second and third place, the loses have been huge.  Cheaper sources, primarily from New Zealand, have cut deeply into overall exports of cheese.


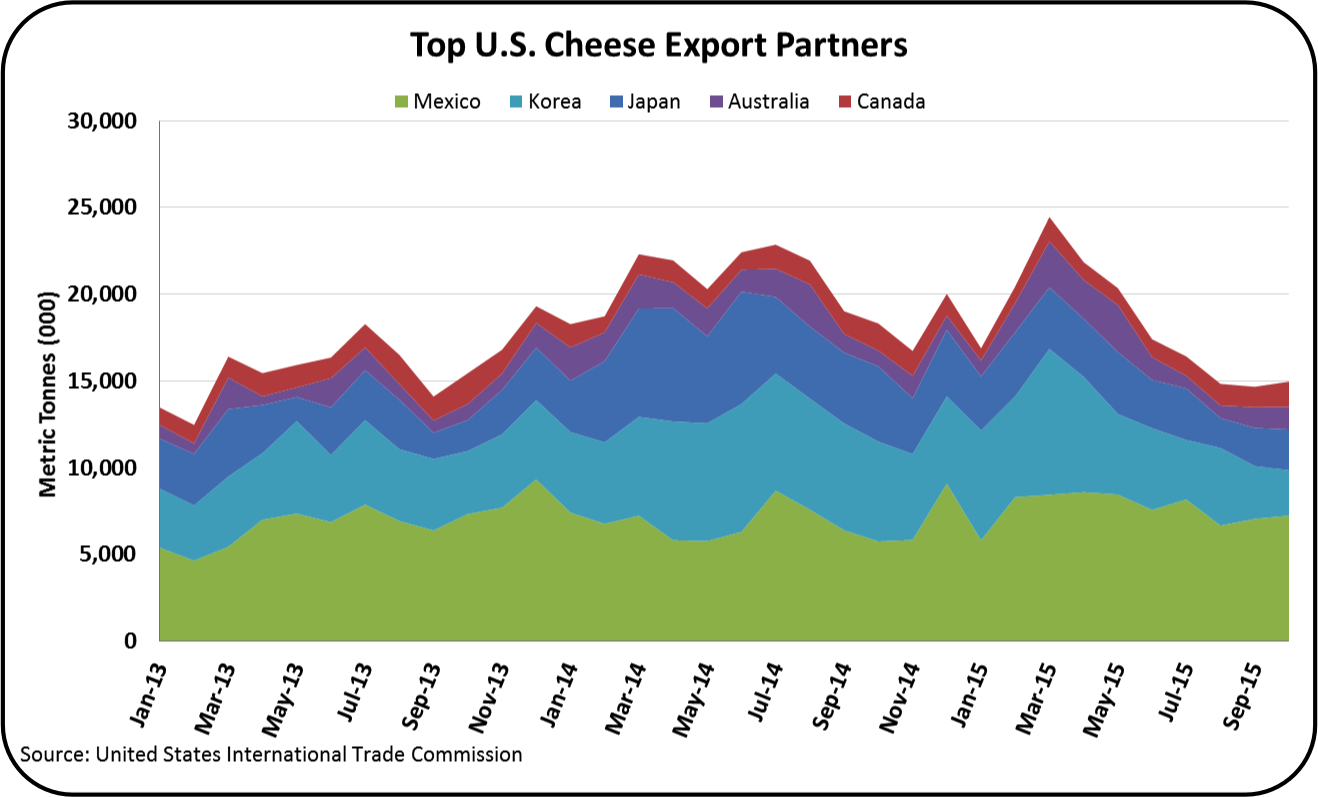
A longer and more detailed view of importing countries shows the significance of these changes.  South Korea was a major importer in early 2015, but that volume has decreased to less than half of the early 2015 volumes.  Japan's imports have fallen from 2014 levels, but have been at a fairly consistent level since the beginning of 2015.  Exports to Canada and Australia have been variable, but are consistent with past levels.  The one country that is still trending lower is South Korea.  

Mexico, our most important customer continues to increase purchases. The month-to-month consistency of current cheese exports in Mexico can be seen in the chart below.  YTD exports are up 13%.


The prior post showed the increased level of U.S. cheese inventories as the volume of exports has diminished.  Compensating for this has been a lower level of cheese production.

Who is the U.S. importing cheese from?  The chart below shows imports by country.  Imports from Italy and France are primarily branded specialty cheeses.  Imports from the Netherlands and New Zealand are mostly bulk cheeses, which can be processed and packaged into retail or food service products in the U.S.  The later bulk purchases are being commoditized.


Butter exports are nearly nonexistent.  The Middle East has found less expensive sources and these butter importers have left their U.S. sources.

The U.S. is currently a net butter importer.  The U.S. was a net butter importer from 2000 to 2008 beginning in 2009,  exports flourished and imports shrunk.  However, in 2015 the U.S. has again become a consistent net butter importer.

 
Where is the source of U.S. butter imports?  The largest exporters of butter to the U.S. are shown below.  Ireland, Mexico, New Zealand, and France top the list.  The imports from Mexico show the greatest year-to-year increase due to the NAFTA agreement.  


Butter pricing in the U.S. has been called a bubble in many prior posts to this blog.  The wholesale price of butter in the U.S. is approximately twice the international prices.  U.S. per capita consumption is up, production is down, and imports are up.  This market is due for an adjustment.  Expect changes in 2016.

 October was an excellent month for NDM exports.  Export volumes reached near record levels for the month of October.


Who did the U.S. export all this NDM to?  The largest NDM customer, was of course  Mexico.  More than 50% of the NDM exports went to Mexico.  Exports to nearly all other countries were down from the prior year as international NDM prices from other countries are lower than U.S. prices.


Dry Whey exports were down 34% from the prior year.  This is weighing heavily on inventories and dry whey pricing.  Dry whey prices are the basis for "Other Solids" prices in the Federal Milk Marketing Orders paid on components.


This has resulted in "Other Solids" having a near zero value.  Prospects for change are very difficult to determine and will probably not occur for some time.  

2015 has been a difficult year for dairy prices.  The Russian embargo on dairy products was renewed and has hurt Europe's dairy exports.  At the same time production quotas for milk production were dropped in EU and production surged, especially in France.  China reduced imports of dairy products and left New Zealand with excess product.  These excesses will be slow to normalize.  The year of 2016 should be a year of recovery, but the recovery may be slow.

Sunday, December 6, 2015

Butter Prices near Record Levels

November prices set records for the Federal Milk Orders paid on components.  Near record highs were achieved for butterfat.  Milk protein fell to lows not seen in over 10 years. Butterfat was priced at $3.18/lb., while protein was valued at $1.32/lb., and other solids were nearly worthless at $.04/lb.  The announced November pricing details can be seen by clicking here.  The dashboard of price movements is shown below.  The 8.8% gain in the price of butter has driven the value of butterfat up 9.4% and driven the price of milk protein down 22.4%.  Other solids showed a nice percentage gain, but it was against a very low base value for the prior month.


The current prices have lead to a very unusual makeup of the standardized Class III price.  Based on the November prices, butterfat made up 73% of the value for Class III milk.


Never in the history of the current pricing model has butterfat been worth 2.4 times the price of milk protein.  In prior posts this has been described as a pricing bubble.  In November, the price of butter increased to near record levels.  At the end of November, the Oceania (Asia/Pacific) price of butter  was $1.31/lb., and the European price of butter was $1.43/lb., both are about half the $2.80/lb. price of U.S. butter.  The price of butter is shown graphically below.  When butter reached a similar high about one year ago, the price fell quickly to near $1.50/lb.


The long term trends show the unusual crossing of butterfat and milk protein prices starting in September 2015.  Butterfat prices have been higher than protein prices for three consecutive months, and the spread between the two prices has grown each month. This has not occurred previously and will likely soon reverse.


Is this being driven by extremely low butter inventories or low production in the U.S.?


Actually, butter inventories were near record highs for the end of October.  October  butter production was near past levels.  New data for November inventory and production levels will be available soon and will be reviewed in an upcoming post.

The case for specifying this as a "butter bubble" seems very clear.  Butter is being imported at significantly lower prices.  Almost no U.S. butter is being exported, as the prices are not competitive internationally

Milk protein took a step drop in November, which was mostly due to the increase in butter/butterfat prices.  There are two components to the price of milk protein, cheese prices and butter prices.  As butter goes up in value, it reduces the value of protein.  When butterfat is worth more when used in butter than when used in cheese, the value of milk protein becomes negative.  In November, the high price of butter actually drove the butter component of the milk protein price formula into negative territory.


Cheese prices have remained fairly stable and the pricing contribution from the cheese price was stable.  Milk protein is down simply because butter is up.

Other solids remain at near zero value as the price of dry whey remains very low.  Other solids are priced based on the value of dry sweet whey.  Whey is an export product and is very much subject to the international market prices.

Overall, the Class III milk price was stable at $15.30/cwt., down just $.16/cwt. from the prior month.  As has been mentioned in prior posts, only the price of cheese has a major influence on the Class III price.  The underlying components that make up the Class III price are cheese, butter and dry whey.  Their influence is expressed in the formula below.  In 2015 butter prices started at $1.56/cwt. and are not at $2.80 /lb.  This has increased the price of Class III milk by only $.53/cwt.

Class III Milk Price = 9.6 x Cheese Price + 5.9 x Dry Whey Price + 0.4 x Butter Price - $3.20
(Numbers above are rounded for readability.)

More details are available on this formula in the April 23, 2009 post to this blog

The futures markets show similar patterns for all the commodities used to price milk.  Prices are expected to drop in the next two months, with strong recovery starting in February 2016.  Amazingly, butter is expected to stay in the $2.00/lb. range, well above the historical levels, but well below the current $2.80/lb.

The international markets continue to play a major role in determining the U.S. dairy prices.  The latest statistics on exports and imports will be available soon and will be analyzed in the next post.