Monday, January 30, 2023

MILK UP - COWS DOWN

There were fewer cows at the end of 2022 than 2021 (Chart I).  But the decrease in cows was out weighted by the increase in milk per cow allowing an increase in milk production in 2022.  In many ways, 2022 mimicked the year 2019, when cow numbers were down but milk was up.  In both cases, the increase in milk was small.  In 2019, the increase in milk over the prior year was .4 percent and in 2022 the increase was just .2 percent.

Chart I - Milk and Cows by Year
The charts below on milk production are presented as 12-month moving averages as the month-to-month data are very volatile and is difficult to track.   

USA milk production was flat in 2022 with a gain of just .2 percent.  To have a supply of milk that will meet the growth of cheese and butter, increases in milk production need to be higher.
Chart II - USA Milk Production
Table I lists the 10 largest dairy producing states.  The largest growth by far occurred in Texas with the addition of 38,000 cows.  The state with the largest decrease in cows was "next door" in New Mexico where cow numbers decreased by 51,000.

The long-term increase of cows in Texas over the last six years amounted to 180,000 cows.  Texas has seen tremendous growth, primarily in milk for cheese and some of the growth has occurred to satisfy the needs of cheese plants in New Mexico where dairy production issues developed from the contaminated water supply.

California is the largest dairy state with Wisconsin in second place and both states have held these positions for a long time.  Idaho finished in third place in 2020 and has held third place for the last three years.  With increased cow numbers and increased milk production, Texas gained fourth place in 2022 .  Next year, Texas will likely be in third place with a continuance of faster growth than Idaho.  In 2018, New York once held third place, but has now slipped to fifth place with very slow growth. 

When ranking states on milk production compared to cow numbers, there is only one change in the rankings.  Michigan would rise to sixth largest from eighth.  Michigan does have the highest milk per cow of any state.  This will be covered in the milk per cow section later in this post.
Table I - Top Ten Dairy States based on
Number of Dairy Cow and Milk Production
Charts on milk production of the four largest dairy states are shown below. 

While California's milk production has not grown much in the last two years, it remains the largest dairy state, ahead of Wisconsin by 25 percent.  California has ended the year 2022 almost exactly where they ended 2021 (Chart III).  California makes about one third of the U.S. butter and their butter production has been steady but with no gains.  (See this prior post on butter)
Chart III - Milk Production in California
Wisconsin shows minimal growth in 2022 with a gain of just .5 percent.  In 2021, Wisconsin gained production by over three percent.   Milk in Wisconsin is used primarily for cheese which is growing by two percent annually.  New and expanded cheese plants in South Dakota may have reduced the Wisconsin milk production.  South Dakota milk production has been growing by 15 percent annually for the last two years.  In 2022, Wisconsin increased milk production 177 million pounds while South Dakota increased milk production by 542 million pounds.
Chart IV - Milk Production in Wisconsin
Idaho milk production grew by 1.1 percent in 2022 and has averaged two percent annual growth over the last four years, close to the amount of growth in dairy domestic consumption and exports.  The growth of Idaho milk production has been steady with gains each year.
Chart V - Milk Production in Idaho
Now we come to fourth place Texas.  The growth of milk production remains around 80 million pounds per year.  Texas has averaged a growth rate of 6.5 percent over the last five years.  Idaho and Texas milk production is currently at the same level of production.  In the last three months of 2022, Texas milk production exceeded Idaho's milk production.  There is a very good chance that the momentum of Texas growth will move them into third place in 2023.  From there, it is still a very long climb to Wisconsin's milk production level.
Chart VI - Milk Production in Texas
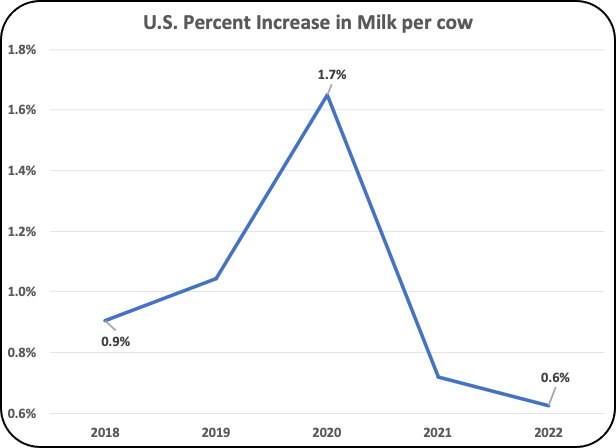
MILK PER COW

More milk per cow means more revenue with less work.  Over the last five years, milk per cow has increased by an average of one percent annually.  The gains have all been positive, but they have not provided consistent growth.  The slow growth in 2022 mimics 2018/19 and could be considered a normal fluctuation.  
Chart VII - U.S. Growth in Milk per Cow
There is a huge difference in the size and growth rate of milk per cow by state.  Table II shows the difference between the top five states and the bottom five states.  From the highest milk per cow, Michigan, to the smallest milk per cow, Virginia, there is almost a 600 pound per month difference.  On the average. the difference is over 400 pounds per month.  That difference represents a lot of producer revenue, for each cow!
Table II - Ranking of the Highest and Lowest Milk per Cow
The three charts below plot the growth of milk per cow over five years for three states.   Michigan increased milk per cow by six percent and Texas gained seven percent.  Virginia grew by just two percent during the five-year span.
Chart VII - Growth of Milk per Cow in Michigan
Chart VIII - Growth of Milk per Cow in Texas
Chart IX - Growth of Milk per Cow in Virginia
The growth of milk per cow combined with increasing component rates can satisfy the needs of domestic consumers and exports.  An upcoming post will cover the 2022 growth of components and the change in Somatic cell counts.


Tuesday, January 24, 2023

Is Dairy Inflation Deflating?

In an earlier post on dairy product inflation, the consumer price index for food was shown to be higher than the overall consumer price inflation index.  That hasn't changed.  In fact, the spread between the retail food index and the overall inflation index has widened.  December 2022 overall inflation numbers dropped to 6.5 percent.  The food retail price index also fell, but not by as much, coming in at 10.4 percent in December 2022.  The spread between consumer price index for food and the overall consumer price index in November was 3.2 percent.  In December the spread was 3.9 percent (Chart I).

This data in this post is based on consumer retail prices from the Bureau of Labor Statistics (BLS) and wholesale prices from the Agricultural Marketing Service (AMS).  Producer milk prices are based on the AMS prices of dairy products.   Prices are compared to the prior year prices.

Chart I - Total Consumer Price Index Compared
to the Food Price Index 

This post will cover the inflation movement of dairy products butter, fluid milk, and cheese.  It will also cover the spreads between retail and wholesale prices.  That comparison shows where the dairy product price increases are coming from.  Fluid milk is a staple that will typically weather the storm of rising prices, but butter has alternative plant based products that mimic butter.  Due to the war in the Ukraine, the plant-based oils used in plant-based margarine have also increased in cost.

The price of cheese as calculated by the AMS is based exclusively on the price of Cheddar.  The cheese section below will cover only Cheddar cheese dynamics.

In the first half of 2022, the difference between retail and wholesale prices (the margin), fell for all the three major dairy products covered.  Apparently, retailers did not increase prices as fast as wholesale prices were increasing.  However, as the high wholesale prices continued in 2022, retail prices were increased to recover margins. 

BUTTER

Butter continues to increase the already high retail prices.  In December 2022, retail butter prices increased by 38.5 percent over the prior year.  That increase was hugely greater than the food price index and the rate of increase is record setting (Chart II).

Chart II - Retail Butter Price Increases Compared
to the BLS Food Index

The wholesale price of butter decreased in November and December of 2022, but the retail prices made only a small decrease followed by an increase.  In Chart III, it is easy to see the tightening of the margin between retail and wholesale prices in early 2022.  In the calculations below for butter there is a one-month lag between the wholesale prices and the retail prices (Chart III).

Producer butterfat prices are based on the wholesale price of butter and fell by 14 percent from $3.66 per pound to $3.15 per pound from October to December 2022.  Retail prices for butter remained high.

Chart III - Retail and Wholesale Prices of Butter

The margin between butter retail and wholesale prices ended 2022 at $1.86 per pound, just slightly below the 2020 and 2021 average margin (Chart III).  The margin includes butter churning, transportation. branding, and retail markups.  The margin did shrink to a low of just $1.16 per pound in February 2022 which means that many in the supply and retail chain did not cover their normal margins as wholesale butter prices started increasing.  By December 2022, the retail butter prices had increased enough to bring the margins to a more normal level and cover the costs to bring the butter to market.

Chart IV below, displays the margin with a one-month lag between wholesale and retail prices.

Chart IV - Butter Margins between Retail and Wholesale Prices

FLUID MILK

Fluid milk price increases peaked in May of 2022 exceeding by far the BLS increase for food.  Fluid milk is a commodity with minimal differences between brands.  The prices increases are approaching the average food index increases, but as of the end of 2022 are still showing a 13 percent increase over the prior year.

Chart V - Retail Fluid Milk Price Increases Compared
to the BLS Food Index

The margins in Chart VI below do not include a one-month adjustment between wholesale and retail as fluid milk is more perishable than butter or cheese and processing and logistics must be completed in a very short time span. The margins hit a low in mid 2022 but recovered to a more normal level by the end of 2022.

Chart VI - Fluid Milk Margins from Retail Prices and
Class I Producer Prices

CHEESE

Cheese prices, as used in the Federal Order pricing system means Cheddar cheese prices.  Cheddar cheese prices did fall in 2021, but are up significantly in 2022.  The rate of increase is now slightly above the overall Food CPI (Chart VII).

Chart VII - Retail Cheese Price Increases Compared
to the BLS Food Index

Cheddar cheese prices have been more stable than butter and fluid milk prices, but the margin spread is much bigger.  At the end of 2022, retail prices of Cheddar cheese hit a high of $6.00 per pound.  The wholesale price has fallen by 14 percent since its high in mid 2022 and ended the year at $2.06 per pound.

Chart VIII - Retail and Wholesale Prices of Butter

The Cheddar cheese margins from wholesale blocks and barrels of cheese to retail consumer packaging prices also took a fall in Mid 2022, but the margin recovered in the last half of 2022.  The margin variation for cheese was only a 14 percent. That was small compared to fluid milk with a 31 percent margin variance and butter with a 35 percent margin variance.

Chart IX - Cheese Margins between Retail and Wholesale Prices

SUMMARY of RETAIL DIARY PRODUCT PRICES

The margins between retail and wholesale for the three items reviewed seem to have reached an equilibrium with the 2020 and 2021 prices.  That part of the retail pricing is now at an established level.  That leaves an open question about where the wholesale prices may go

The inventories of American cheese are low and may prompt a higher wholesale Cheddar price in 2023.  Fluid milk pricing is based equally on skim Class III and IV pricing.  It difficult to predict where NDM pricing factors for Class IV are going because NDM is an export product.

Butter retail pricing may still have room for upward movement.  Inventories are very low.  As a result, further wholesale and retail butter inflation is possible.  Higher wholesale butter prices would bring butterfat prices to another new high improving producer milk prices.  However, as retail butter prices maintain or increase today's high prices , consumer purchases may not grow and may shrink.  This could have a lasting impact on butter domestic sales.  The U.S. may become more dependent on butter exports in the future if butter churning is to expand.


Tuesday, January 17, 2023

Layer Three of the Milk Price Onion - Dairy Commodities

In the prior two posts the 2022 milk Class prices were covered and the 2022 component prices were covered.  The component prices are used to establish the milk Class prices.  In this third post, the commodities that are used to calculate the component prices will be covered.   In a sense, this is the third level of peeling the milk price onion down to see where and why producer milk prices have moved and where they might be going.

There are four commodities that are used to price components, and they are butter, cheese, dry whey, and nonfat dry milk.  In three of the four commodities reviewed below, inventories are low to normal.  Scarce inventories will keep prices reasonably high.  The one commodity with a huge inventory is dry whey and for that reason the value of dry whey is and will remain low.  Other solids pricing, which is based on the price of dry whey, is not a major contributor to milk prices.

BUTTER PRICES

The first to be reviewed is butter.  Consumption of butter has been growing at around two percent annually.  In the last two years, retail butter prices have increased significantly, and this may be dampening demand.  Wholesale butter prices charted below have seen tremendous continuing price increases, setting new record highs every month through October 2022.  There has been a little drop in the wholesale butter price in November and December 2022.

Butter Prices

The increases in butter prices are caused by basic supply and demand.  Butter wholesale inventories have been decreasing and still are.   In November, inventories fell further.  November's inventory of 200 million pounds is down five percent from the prior year and the prior year at 210 million pounds was already very low.  The year to prior year decline has been continuous for the last 16 months.  

Butter Wholesale Inventory

A major part of the problem is that butter churning is down.  While year-to-year production should show increases to match growing domestic consumption, production is falling.  November 2022 did provide a slight increase in production from the prior month, but it is still a very low production volume.  The main culprit is a lack of milk combined with increased butter exports.  While exports are still small compared to domestic disappearance, they have been growing for the last two and a half years.  Milk producers and butter processors struggle with labor shortages, high feed costs, and uncertainty for the future.  For more information on butter pricing, click here.

Butter Production

CHEESE PRICES

Cheese prices are the major factor in pricing milk protein.  The "cheese" price announced by the Agriculture Marketing Service (AMS) is based only on Cheddar cheese wholesale prices.  The price has been escalating in 2021 and 2022.  Every month of the year 2022 is higher than the same month of 2021.

Cheese Price

Cheddar cheese inventories are not available publicly, but Cheddar cheese makes up about 70 percent of American cheese.  Inventories of American cheese, shown below, were highest in mid 2022 but have fallen to a low by November 2022.  Low inventories support higher cheese prices and higher protein component prices.

American Cheese Inventory

Production of Cheddar cheese, shown below, has been declining in 2022.  The low production rate has stretched inventories and supported good Cheddar cheese prices.  The decreased production has been caused by a shortage of raw milk, labor shortages, and uncertainty.

Cheddar Cheese Production

DRY WHEY    

Other solids are priced based on wholesale dry whey prices.  The chart below shows the rise and fall of dry whey prices.  They have been very volatile, especially in 2022.  Dry whey has dropped from $.79 per pound to $.46 per pound, a 42 percent fall.

Dry Whey Prices

Dry whey inventories are high compared to 2021.  In early 2022, inventories grew.  Because cheese production continues to grow annually, that leaves more whey to find a home.  Ninety eight percent of the dry whey is consumed by people, not animals.  About half of dry whey is exported and is subject to international fluctuations.   This includes whey permeate (whey with no protein). a large part of which is sold to China for their swine industry.

Dry Whey Inventory

Dry whey production has been volatile, but at the end of the year, it remains even with the prior year.

Dry Whey Production

NONFAT DRY MILK

NDM prices have increased and decreased.  At year end NDM prices remain even with the prior year.  NDM is used to price the skim milk for Class IV.  Because skim Class IV prices are used in valuing skim Class I and skim Class II milk, they are a major factor in producer milk pricing. 

NDM Prices

Inventories of NDM milk are ending even with the prior year.  Without a surge in inventories, prices should be stable.

NDM Inventory

Production of NDM is neither high or low.  Over 70 percent of NDM is exported, so demand and prices can vary with exchange rates and international competition.

NDM Production

SUMMARY

As mentioned at the top of this post, the inventories and production of the major commodities used to price milk components show no signs that would weaken producer milk prices. Dry whey is an exception and currently has very high inventories.   The price of dry whey is used to price "Other Solids" but has little impact on overall producer prices.


Wednesday, January 11, 2023

LAYER TWO - THE PRICES OF COMPONENTS USED TO PRICE MILK CLASSES

This post will cover the component pricing in 2022, the second layer of peeling the milk pricing onion.  There are four components that are responsible for the milk Class prices discussed in the previous post.  The four components are butterfat, milk protein, other solids, and nonfat solids.  The amount of these components and their prices are used for the first payment to all producers in the Federal Milk Marketing Orders.

COMPONENT PRICEING IN 2022

Butterfat is having a huge surge.  It set new record highs every month of 2022 until November.  The price dropped in November and December, but it is still high.  The current butterfat price is higher than any other butterfat price prior to June 2022.

Is this the start of a major decline in butterfat prices?  In the December 2022 post to this blog, inventories and butter production data indicated that the high butterfat prices are not ready for a major decline.  That data will be updated and reviewed in the next post with the most recent data.

Butterfat prices, which are based on the wholesale butter price, are the only component supporting strong producer milk prices.

Butterfat

Milk protein prices are in a slight decline pattern.  When butterfat goes up in price, milk protein prices go down based on the Agricultural Marketing Service (AMS) formulas.   Below are the formulas for pricing milk protein.  The first formula is the AMS formula for pricing milk protein.  The lower protein formulas are simplified to make them clearer but they have all the elements of the AMS formula.  The simplified formulas clearly show why milk protein prices decline when butterfat prices increase.

AMS Formula
Protein Price = ((Cheese Price - .2003) x 1.383) + 
((((Cheese Price - .2003) x 1.572)  - Butterfat Price x .09) x 1.17)
    
Simplified Formula

Milk Protein = 3.22 x Cheese Price - 1.27 x Butter price - $.43
or
Milk Protein = 3.22 X Cheese price - 1.05 x Butterfat price - $.65

Protein peaked at $3.87 per pound in May 2022 and fell to $1.88 per pound in October 2022.

The year 2022 stared with a butterfat price of $2.29 per pound and peaked at $3.66 per pound in October.  That is an increase of $1.37 per pound of butterfat.  That butterfat increase lowered the milk protein value by $2 per pound.  Cheese prices increased during that time and largely offset the impact of higher butterfat prices.

Protein

Other solids are priced based on the dry whey price. It is also down in price falling from $.61 per pound at its 2022 peak to $.27 per pound at the end of 2022.  That is a decrease of over 56 percent.  It is a small contributor to the overall pricing of milk.

Other Solids Price = (Dry Whey Price-0.1991) x 1.03

Other Solids

Nonfat solids are used to price Class IV skim milk.  Nonfat solids are primarily used for production of nonfat dry milk.  Nonfat solids started the year at $1.37 per pound, and closed 2022 at $1.28 per pound, a small loss.  During 2022, nonfat solids peaked at $1.65 per pound.

Nonfat Solids

During 2022 the prices of milk protein, other solids, and nonfat dry milk all peaked and then fell.  This is a coincidence as they are not all controlled by the same commodities that are used to price components.  Butter prices held up well but did begin a small decline starting in November.

The final layer of the milk pricing onion will cover the commodities that influence the price of components.

WHAT DOES THIS MEAN TO A PRODUCER'S REVENUE?

This section will briefly analyze a simulation that will cover changes in producer payments as component prices change and as component levels change.

The simulation will begin with a base case for a producer with 1000 cows, each producing 80 pounds per day with butterfat at four percent, protein at 3.25 percent, and other solids at 5.7 percent.  The prices used for these components is based on a five-year average price.  Butterfat is priced at $2.38 per pound, protein is priced at $2.66 per pound, and other solids are priced at $.26 per pound

The simulation will use the following cases:

  • The base case is calculated from the data above.
  • The butterfat cases change only the price of butterfat changing it up and down by $.40 per pound.
  • The protein cases change only the price of protein changing it up and down by $.40 per pound.
  • Increased butterfat levels change only butterfat levels increasing butterfat from four percent to 4.2 percent. 
  • Increased protein levels change only protein levels increasing protein from 3.25 percent to 3.4 percent.
  • The final simulation increases butterfat and protein as this is a typical pattern when applying techniques like amino acid balancing.  Incremental increases in butterfat and protein are strong factors in improving revenue.

 Here are the results.

Revenue from Changing Commodity Prices and Component Levels

As butterfat prices increase and decrease, the impact is minimal because when butterfat go up in price, protein prices go down and when butterfat prices go down, protein prices go up.  When protein prices go up or down, the impact is over five times greater than butterfat price changes.  A producer has no control over these prices and they will vary.

When butterfat and protein levels increase, there is a significant revenue increase.  Increasing component levels can have a major and lasting value and is under the control of a producer and his nutritionist.  The calculations used in this simulation were made using the app milkpay.com 


Thursday, January 5, 2023

Were the Producer Milk Prices in 2022 Good or Bad?

The Agricultural Marketing Services (AMS) "Class and Component Prices" for the full year of 2022 are now available.  Were they up? Yes, in the first half of 2022. Were they down?  Yes, in the last half?  What components are achieving high prices?  That's easy, its butter!  

Analyzing the producer milk prices is like peeling off layers of an onion.  After covering milk Class prices in this post, the next post will cover the second layer of the onion.  That is the component prices that make up the milk Class prices.  The third and final post of this set will cover the third layer which is the production and inventories of the commodities that are used to price the components.

While Milk prices were very positive in the first half of 2022, decreases in the last half of 2022 were widespread.  The milk prices posted monthly by the AMS are an index based on component levels of butterfat at 3.5 percent and protein at three percent.  Those numbers are out-of-date but good for annual comparisons.  Butterfat is currently averaging over four percent and protein levels are near 3.25 percent, so producers are achieving revenues well above the posted AMS index values by increasing component levels in their milk. 

LAYER ONE - THE MILK CLASS PRICES

The four Classes of milk show similar patterns in 2022 with highs in the middle of the year and decreases in the last half of the year.  The prices of the different Classes are not based on the same components but they did follow the same rise and fall. 

Table of 2022 Class Values

To further illustrate the movement of prices in 2022, the four charts below show the transitions by month for each milk Class in 2021 and 2022.

The Class I fluid milk base price reached its highest 2022 point in June and July with $25.87 per cwt.  By the end of the year, it had fallen to $22.58 per cwt., a nine percent drop.  The skim Class I price is based on an even price mix of skim Class III milk and skim Class IV milk.  The Class I base prices in 2022 do show a nice increase in each month compared with the prior year.

Class I Milk Prices

The Class II prices show a nice escalation in 2022 over 2021.  Class II milk reached its 2022 high in August at $26.91 per cwt. and fell to $23.11 per  cwt. at the end of the year, a 14 percent drop.  Class II milk is the smallest Class of producer milk and has a small impact on the "Uniform" or average price of all Classes of milk. The good news is that the 2022 prices were higher than 2021 in every month of the year.  

Class II Milk Prices

Class III milk for cheese is the largest category of milk usage.  It also shows a consistent pattern with a 2022 high of $25.21 per cwt. in May and a low of $23.11 per cwt. at the end of 2022, an eight percent loss.  Class III milk pricing is based primarily on the wholesale price of Cheddar cheese which will be covered in the third blog post of this set.  The Class III milk did achieve significantly higher prices in 2022 compared to 2021.

Class III Milk Prices

Class IV prices are based on an entirely different basis than Class III but show a similar pattern of midyear highs and decreases in the last half of 2022.  Class IV milk prices reached $25.83 per cwt in June of 2022 but finished the year at $22.12 per cwt. a 14 percent drop.

Class IV Milk Price

The skim milk prices are shown below for Classes III and IV only. Class I skim is based on Class III and IV skim prices.  The Class II volume is relatively small.  In both Classes III and IV, the price of milk has fallen below 2021 prices at the end of the year.  Without the butterfat, which is high priced, skim milk prices are ending 2022 with prices lower than 2021.  

The Class III skim price is showing deterioration in the last half of the year.  From a high of $14.86 per cwt. in May 2022, the price fell to $9.80 per cwt. by the end of the year , a 34 percent drop.

Class III Skim Milk Price

Skim Class IV milk had a peak value of $14.82 per cwt. in May 2022.  By the end of the year the price had fallen to $11.48 per cwt., a 24 percent drop.  Skim Class IV milk prices are based on the price of Nonfat Dry Milk (NDM) which is primarily an export product. International prices for NDM have fallen in the last half of 2022.

Class IV Skim Milk Price

What is easily seen in the two skim milk charts is that without high priced butterfat, all Classes of milk are closing with 2022 at lower prices than 2021.

The year 2022 achieved highs in all milk Classes in the middle of 2022 based on the surging butterfat prices and strong Class III and IV skim milk prices.  By the end of the year, only butterfat continued to maintain historically high prices.

WHAT'S NEXT?

The next post will cover the pricing of the components that are used to calculate the Class prices.  Those components are butterfat, milk protein, other solids, and nonfat solids. They represent LAYER II of the analysis of the milk prices.
 
The final post will cover butter, cheese, dry whey and NDM.  That analysis will cover production and wholesale inventories of these commodities as the pricing is typically linked to these factors.  They represent LAYER III of peeling the milk pricing onion.