Sunday, December 8, 2013

Class III Milk Prices Hit a 2013 High

November 2013 Class and Component Prices were announced on December 4.   The Class III price was $18.83/cwt., which was a record for the year.  The Class III milk price increase was driven by the increase in the milk protein price, which was up 6.5% to $3.63/lb., also a record for 2013.


The long-term trends again reflect the increasing value of milk protein in the mix of dairy components.  Protein is needed for the economical production of cheese, the thickening of yogurt, and for production of Skim Milk Powder.  These three diary products are the growth items for the U.S. dairy Industry.   Butterfat was below the trend line at $1.63/lb.  "Other Solids" retained it's new value level at $.40/lb.


Payment for milk protein hit a record 58% of the total Class III milk price in November.  Milk protein production is key to producer revenue and  feed management of amino acids in the diet can positively influence milk protein production.  This practice is increasingly important for a dairy producer's financial success where there is payment for protein.


Inventories of the key end products that are mathematically linked to milk prices are discussed below.   These inventories are all relatively low which will help maintain and drive favorable milk pricing.

INVENTORIES

Cheese is the most important driver of milk prices.  (See the April 23, 2009 post to this blog for an explanation of this.)  Below are the charts of natural and American cheese stocks.  These inventories were high in early 2013, which created concern for dairy pricing.  These stocks have now fallen to the safe levels which should maintain favorable cheese and Class III milk prices in the near term.


Dry Whey has gained importance, as it is the basis of "Other Solids" pricing, which is contributing over $2/cwt. to the Class III price.  The dry whey inventories are very low which is keeping the value of "Other Solids" at near record levels.


Butter pricing is the key determinant of butterfat prices.  It is a very small contributor to the standardized Class III price but it can be important if a producer is able to improve the butterfat content of his milk.


The Nonfat Dry Milk prices can also contribute to producer revenue as a higher price can influence the Class I, II and IV milk prices, which in turn influence the Producer Price Differential.  (See the October 6, 2013 post to this blog for an explanation of these formula driven interactions).  The inventory of nonfat dry milk is extremely low.  This should ensure a strong price for the near future.


One of the big factors driving the lower inventories is exports.  Please see the companion post to this blog covering exports and exchange rates for more details on dairy exports.


Dairy Exports Continue to Rise

This blog post is intended to support the post on November Class and Component prices with an analysis of the most recent dairy export data.  Dairy exports are becoming a very important sector for growth of the U.S. Dairy Industry.  They also bring increased volatility to the Industry.

Dairy Export data for October 2013 was available on December 5.  These exports continue to hit new highs.  In October, 16.3% of the total milk solids produced were exported.  There are increases across all product export categories. The most exported products are Nonfat Dry Milk/Skim Milk Powder, Dry Sweet Whey, and Lactose. The majority of these three products are exported and these exports therefore have a significant impact on the price of Nonfat Dry Milk (the basis on the Class IV milk price) and the price of Dry Whey (the basis of "Other Solids" pricing for Class III components).

Mexico remains the biggest U.S. export customer, nearly double the next largest export customer, South Korea.

The majority of the export market depends on products with minimal water content for economical international shipping.  Therefore component levels are key to this market.

The price of Cheese is the most important parameter of Class III milk pricing and cheese exports continue to drive added product demand.  For the first 5 months of 2013, cheese exports managed only slight increases over 2012.  However, for the next 5 months cheese exports have shown significant increases compared to the prior year.  While this is a nice gain, cheese exports at 6.1% of production YTD are the lowest export category.  There is still a great opportunity to increase cheese exports.


Similarly, butterfat exports are at all time highs for the months of September and October.  This is also a significant increase over the early 2013 months.   The U.S. has exported just over 10% of butterfat produced.

Whey exports remain strong but are not significantly above prior year levels.  The majority of dry whey is exported and strong exports need to keep pace with the increases in cheese production to keep whey prices high.  The Class III "Other Solids" price is determined by the price of dry whey.


In recent months, the price of nonfat dry milk has increased and it is now positively influencing the Class I, II and IV milk prices.  (See the October 6, 2013 post to this blog for an explanation of this relationship.)  Like dry whey the majority of nonfat dry milk/skim milk powder is exported.  This export market is, therefore, very important to maintaining strong demand and good nonfat dry milk prices.  
The global market standard is skim milk powder, which has a minimal protein content of 34%.  Nonfat dry milk has no minimal protein content.   For the last two months, U.S. production of skim milk powder has reached a new high of over 40% of the total of production of nonfat dry milk/skim milk powder.  This change to more skim milk powder demonstrates that the U.S. dairy industry is recognizing the opportunity for U.S. dairy products globally and positioning the industry to meet the specific demands of the global market.

EXCHANGE RATES

Very important to these exports is favorable exchange rates.  A weaker USD makes U.S. dairy products less expensive than the competition in the global market.  On the charts below, a weaker USD is shown as a positive (higher) value.  The most noticeable point on the USD/NZD chart below is 2008 when the U.S. dairy export market crashed as a result of the strong USD.  Currently, the USD is at a reasonably weak position supporting U.S. dairy exports.


The other major competitor in the global dairy market is Europe.    The USD has slightly weakened in 2013 also supporting U.S. dairy exports.


Click here to see the December post on the positive influence of dairy exports on product inventories and component prices.


Sunday, November 10, 2013

Producer Milk Prices Remain Stable

On October 30, Class and Component Prices for the Federal Milk Marketing Orders were announced for October 2013.  Since the government shutdown, the Marketing Order web site has not been fully updated, but when this is updated, the pricing details will be available on the Milk Price Announcements, Summaries, and Product Prices web page.  For the next few weeks, the October announcement will be available at the "most recent" report link.  This month's announcement is a slightly abbreviated format.


The Class III Milk Price was up slightly at $18.22/cwt.  Protein and Other Solids were down slightly and butterfat was up significantly.  The Nonfat Dry Milk price did increase, thereby increasing the Class IV Milk price.  This will have a positive impact on Class I Milk prices and the Producer Price Differential (see the October 6, 2013 post to this blog for an explanation of these formula driven interactions).

October pricing is consistent with long-term trends and future expectations.  Protein remains above the trend line indicating an expectation of an improving trend and butter is below its trend line indicating a change to a level more consistent with long term expectations.


The pie chart of component contributions to the Class III price remains consistent with recent values.  The market dynamics, with more milk going to cheese and yogurt, require higher protein milk.  To encourage producers to produce higher protein milk, a higher value for protein is needed.  At $3.42/lb. plus bonuses frequently paid for higher protein milk, producers are being financially rewarded for higher protein milk.  Payment for protein made up 56% of the Class III milk value.


Dairy producer prices are determined by the supply and demand of cheese, butter, dry whey, and nonfat dry milk.  The most important one of these by far is cheese.  Changes in supply happen slowly as lead-time is required to expand herds and producer facilities.  On the demand side, consumption is also slow to change.  However, exports can change quickly and, therefore, are the most volatile piece of supply and demand.   

The most important current news is the recently improved trends in exports (especially cheese).  Export data is now available through August 2013.  The charts and data below are from the U.S. International Trade Commission database and the U.S. Dairy Export council.

The remainder of this post reviews the current progress on these improving trends in exports.  Cheese will be emphasized due to its importance in determining Class III milk prices (see the April 23, 2009 post to this blog for an explanation of this.)

EXPORTS

Cheese exports tracked at prior year levels for the first part of 2013 and that was troubling.  However, in the last three months, there has been a significant improvement.  Exports reached a significant high for the month of August.


Other product export charts are shown below without comment to emphasize the overall improvement in dairy exports.  The data for 2013 is consistently shown in blue.


The table below shows the year to date comparisons of exports.  With one exception, all items are significantly up over the prior year.


Most everyone remembers the upheaval in dairy prices in 2008/9 caused by the extreme fluctuation in exchange rates between the USD and the New Zealand Dollar (the blue line in the chart below).  Cheese exports doubled and then crashed causing serious disruptions in supply and demand of cheese in the U.S. Dairy markets.  It was a period of "Riches to Rags".  The chart below shows the comparative export and exchange rates for the last six years.


The current increase in exports has been helped with a weaker USD, but the change has been minimal and slow.  The growth in cheese exports has been a little volatile, but shows a very nice trend of increases.  

Inventories of cheese are returning to reasonable levels after a scary first half.  The same can be said for butter, dry whey, and nonfat dry milk although they are not shown below.


There are always new disruptive events in business, but the important supply and demand ratios are currently well aligned and hopefully will create a period of sustained stable producer prices at reasonable levels.  When the current milk prices are combined with the current lower grain and oil seed prices, there is a financial opportunity for dairymen. 

Sunday, October 6, 2013

Dairy Prices and Fundamentals Improve - See How Nonfat Dry Milk Exports Help Prices.


On October 2 the Federal Milk Marketing Order Class and Component Prices for September were announced.  Due to the Federal Government shutdown, the website usually referenced here is not available.  In place of that document, the Upper Midwest announcement is referenced.  The Class III milk price of $18.14 was improved by $.23/cwt. from the prior month.

Every component tracked on the monthly dashboard below was positive.  Additionally, the high inventories of cheese that were mentioned in prior posts to this blog have been reduced.  As a result, Class III future prices have also improved.


The September prices follow the long-term trends at reasonable levels.  Protein increased to $3.54/lb. and butterfat increased one cent to $1.52/lb.  Other Solids, steady at $.39/lb. continue to contribute over $3/cwt. to the Class III milk price.


The breakdown of the Class III milk price again set a record for protein, with protein making up 59% of the Class III price.  Butterfat's contribution fell to 29%.


Very importantly, the high inventory levels of Cheese seen in the first half of 2013 have drastically improved.  Increased exports started to materialize in July 2013.  No later data is available, but it is extremely likely that when the data is reported, it will show a continuation of this trend.


This month's data is extremely positive.  Therefore, the remainder of this post will deal with a new trend that is having an impact on milk pricing.  Nonfat Dry Milk exports are very robust and they have led to a 13% increase in the price of Nonfat Dry Milk.  The impact of this change is disproportional within the Federal Milk Orders as will be analyzed below.

THE IMPACT OF NONFAT DRY MILK PRICING

The price of Class III milk is determined by the NASS cheese price (see the April 23, 2009 post to this blog.)   However, the price of Class IV milk is determined by the price of Nonfat Dry Milk.  The price of Class IV milk can influence the price of Classes I and II Milk and can also impact the Producer Price differential.  The winners in this scenario are the Federal Orders paid on the Advanced System and the Orders paid on components that produce significant amounts of Class I, II, and IV milk.

The Class I price is announced in Advance of the month.  The price of Class I Skim Milk is based on the higher of the Advanced Class III or IV Skim Milk Pricing.  The majority of the time, the Advanced Class III is the higher.  However, this changed starting in March 2013.


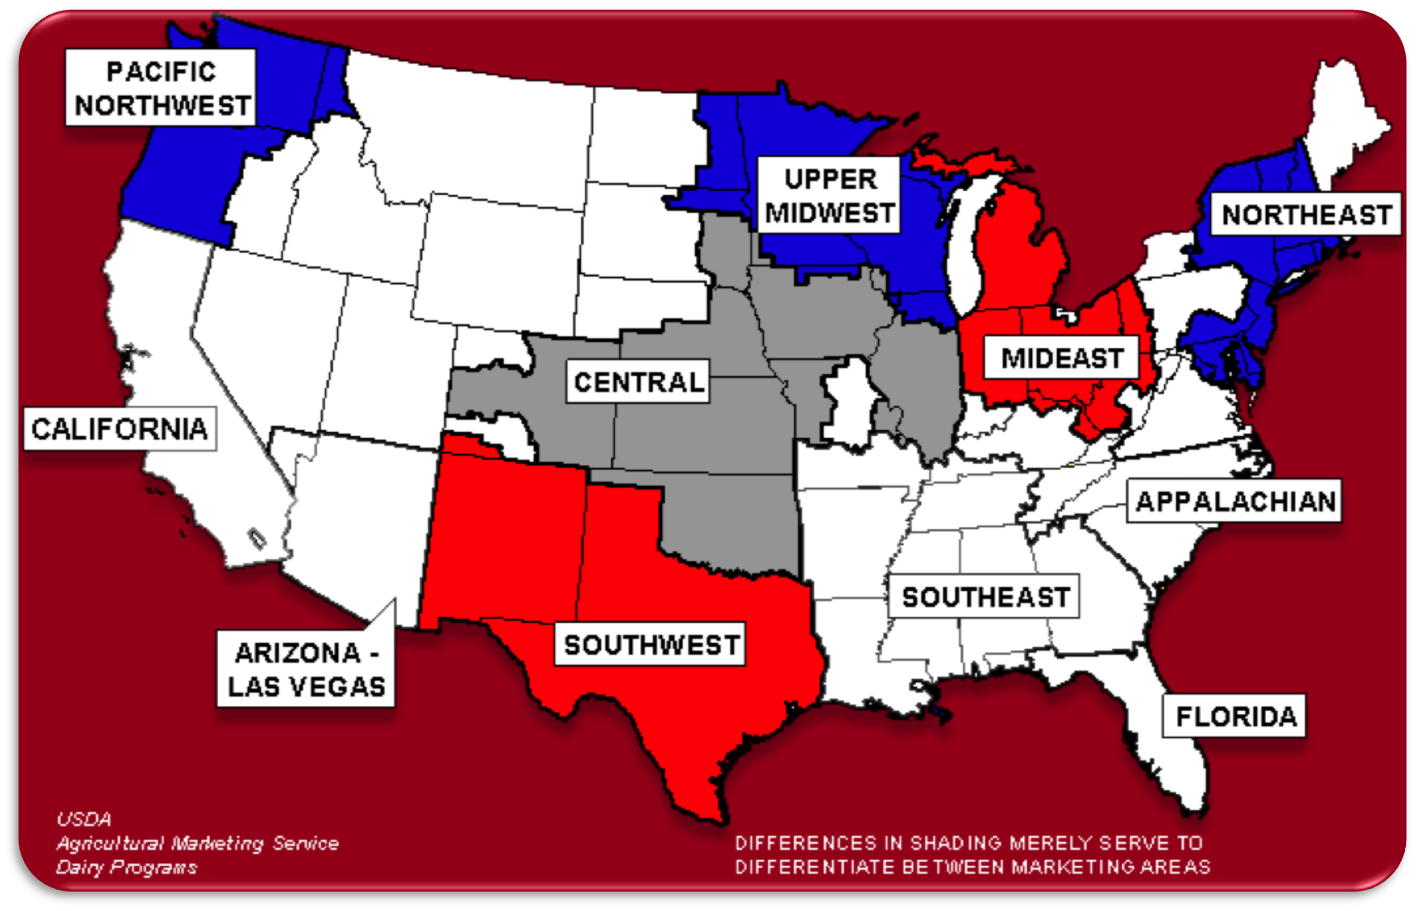
By October, the differential between the advanced Class III and IV was $1.33/cwt., a clear advantage for Class I milk pricing.  Who does this impact the most?  The four Federal Orders paid on the advanced pricing system (about 11% of the USA milk produced), include Florida, Southeast, Appalachian, and Arizona - Las Vegas Federal Milk Orders.  These Orders get the advantage of the higher Class I price.  Arizona - Las Vegas also has the benefit of having a significant Class IV NDM business, produced primarily for export.


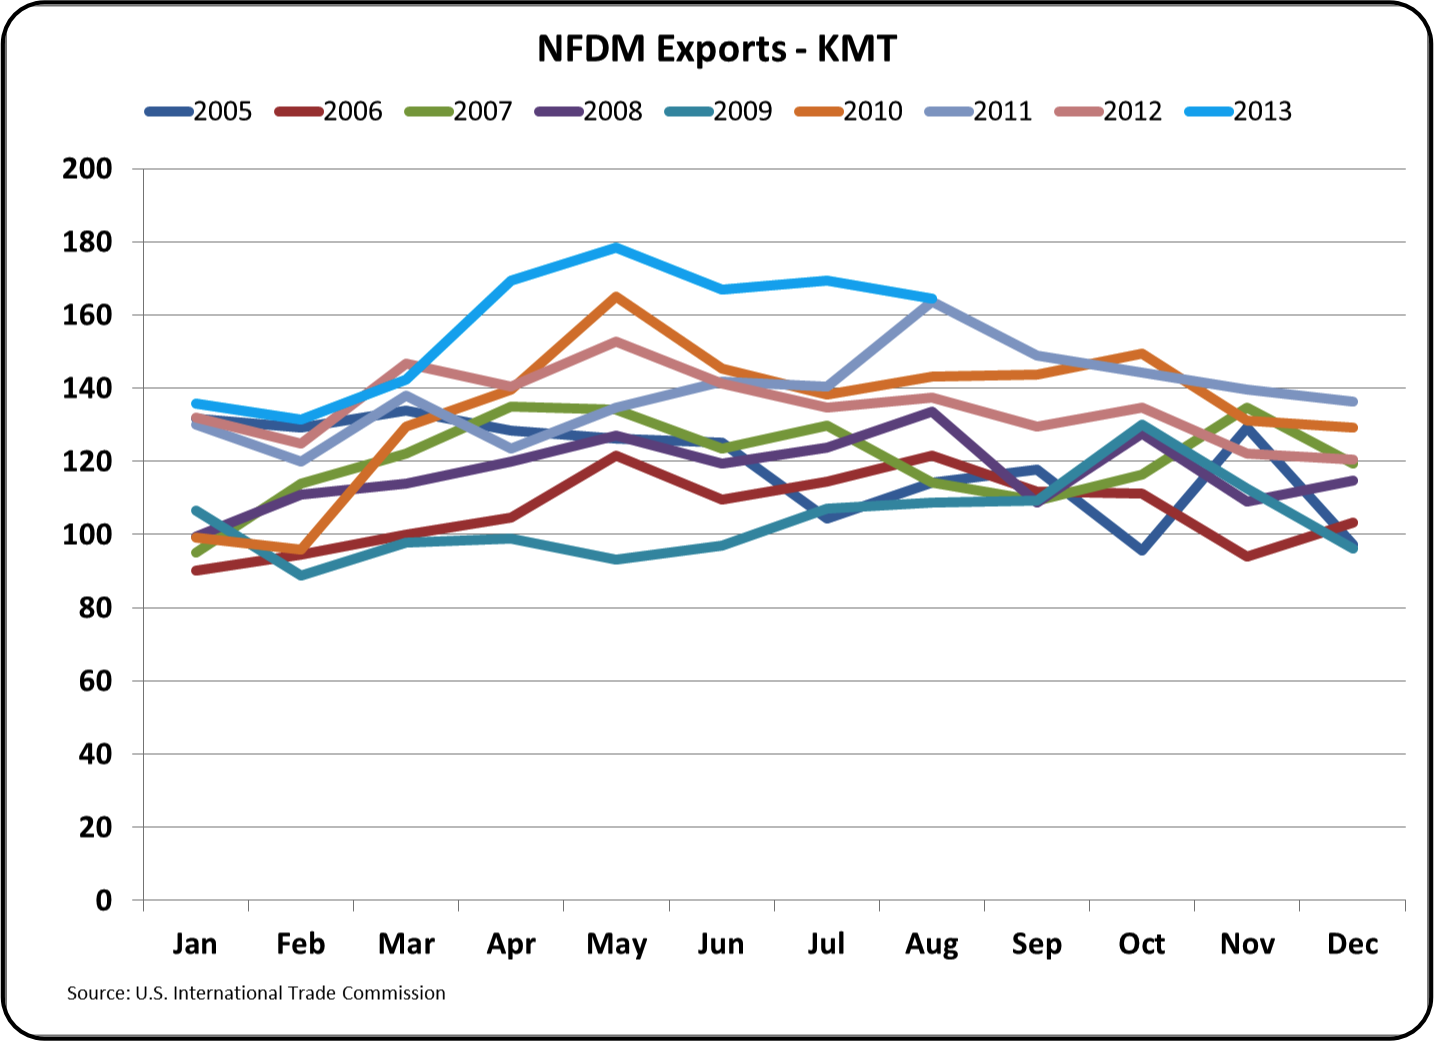
This price increase for Class IV milk was driven by increased exports of NDM, illustrated in the chart below.


Nonfat Dry Milk exports were up 16% YTD for the first seven months of 2013 vs. 2012.  YTD 52% of the NDM/SMP was exported.

This also impacts the Producer Price Differential of the Six Federal orders paid on components (see the May 10, 2009 post for a more detailed explanation of the Producer Price differential).  Producers in these six orders are initially paid at the Class III price. The difference between the Class III milk price and the weighted average of the four milk classes is the Producer Price Dfferential.

In 2012, the percentage of each of these classes was a follows:


The Federal Order with the least amount of Class I, II, and IV has the least advantage.  This characterizes the huge Upper Midwest Order where 79% of the milk is Class III for cheese production. The Northeast Federal Order has the biggest gain with 78% of its milk in Class I, II, and III.  The Producer Price Differentials for August were announced in mid-September and are as follows.


The interrelationships in these calculations are complex.  Please feel free to contact the author with any questions.


Sunday, September 8, 2013

Gains in Milk Protein Prices Drive the Class III Milk Price Up.

The August Class and Components prices were announced on September 5.  The Class III milk price was $17.91/cwt., a 3% improvement over the prior month.  The butterfat price dropped to $1.51/lb., down six cents from the prior  month.  Milk protein however advanced 8% to $3.48/lb. based on an improved cheese price and a weaker butter price (click here for an explanation of this relationship).  The increase in the price of cheese was surprising as cheese inventories remain well above historic levels.


The three components that make up the Class III price are returning to the expected relationship of milk fat around $1.50/lb., milk protein near $3.50/lb., and the new norm for other solids of around $.50/lb.


In terms of the relative value of each component, milk protein hit an all-time high making up 58% of the milk check.  Of the $17.91/cwt. Class III price, milk protein contributed $10.40 based on the USDA standards of 3% protein, 3.5% fat, and 5.7% other solids.


The remainder of this post will concentrate on factors that influence the price of cheese, which has a major impact on the Class III price.  The relationship between the NASS wholesale price of cheese and the Class III milk price is shown below.  The math behind this relationship is explained in a prior post to this blog.


CHEESE INVENTORY AND EXPORTS

In spite of the excellent August price for cheese and the resulting excellent price for milk protein, there is still reason for concern.  Cheese inventories are still very high and may have a future downward impact on cheese and Class III milk prices.  The high inventory level discussed previously in this blog has not significantly changed or improved as of the end of July.


Cheese production has continued it's long term trend of growth as shown below, but cheese domestic consumption and cheese exports have lagged vs prior growth rates.  (See the April 7, 2103 post to this blog for a discussion of domestic consumption.)  Cheese exports are growing, but nowhere near the level of increase in prior years.


The United States Dairy Export Council releases a monthly report on dairy exports.  They have done an excellent job in growing the U.S. dairy industry exports.  However, the gain in exports in 2013 has not kept pace with prior years, especially in cheese exports.  In their report for H1 of 2013, they summarize the USD export growth at 16% vs. prior year.  However, the most important component for milk pricing, cheese, grew only 6% in volume, a significant drop from prior years.


Cheese net exports (exports - imports) show almost no gain in H1 2013 over H1 2012.


The chart below shows the H1 growth in net exports (total exports - imports) over the last three years.  The annual growth in 2011 was 137% and for 2012 it was 46%.  The growth of 6% in 2103 is a huge fall from the prior years.  


The change to almost no gain year over year was not expected as the industry produced to a level that  was suggested by the past gains.   Increases in cheese manufacturing capacity require long term planning, with capital expenditures, supply contracts, and labor hiring and training.  That momentum is hard and expensive to quickly change.  Probably only lower cheese prices, and therefore lower milk prices will force a reduction in cheese production.  The alternative is to wait out the lull and endure the lower prices until demand does increase to the current level of production capacity.  Either way, lower prices do seem to be on the horizon.


Sunday, August 4, 2013

July Class III Price Drops

The July Class and Component Prices were announced July 31.  Butter and cheese prices were down, driving down the milk fat and milk protein prices.  Whey prices did increase giving a slight price boost to "Other Solids," one of the three elements in the Class III price.  The Class III milk price fell to $17.38/cwt. from $18.02/cwt. in June.


The long-terms trends showed a consistent pattern.  Milk protein remains above the long term trend line which will increase the trend line over time.  The protein price would show a steady increase if it were not for the disruptive movement of prices  in the 2008-09 period.

Milk fat prices continue below their long term trends and at $1.57/lb. are near the long-term price of $1.50/lb.

The price of "Other Solids" which are based on the NASS dry whey price continue to be the game changer with a price of $.39/lb.  The demand for whey continues to pressure the supply from cheese manufacturing keeping the price of whey at a level above the historic levels.  This is expected to continue.

The update to the June inventories posted one week ago showed cheese inventories above historical levels.  If this results in a decrease of cheese production as might be expected, it will also reduce whey availability and therefore maintain or increase the price of whey.


The three elements contributing to the Class III milk price remained consistent with the June chart.   Milk fat contributed only 32% of the value in Class III milk.   The remaining 68% came from milk protein and "Other Solids,"  both of which are highly influenced by cheese production levels.


Because the inventory and export levels were updated one week ago in the June blog post they will not be restated there.  The inventories of cheese and butter are too high and this is influencing the price of milk protein and milk fat.  Until the inventory levels are reduced,  milk protein, milk fat, and the Class III price will be negatively influenced.

The remainder of this post will review the tight relationship of cheese prices to the Class III price and the factors that can influence cheese disappearance.

WHAT DRIVES THE CLASS III PRICE?

The cheese price as measured by NASS is linked very closely to the price of Class III milk.  The correlation is a tight 96% as illustrated in the chart below.  The reason for this is that the two are linked mathematically.  The math behind this relationship is explained in the April 23, 2009 post to this blog.


There are only three elements that influence the cheese price:
  1. Production
  2. Domestic consumption
  3. Exports
Production has  increased consistently over time.  There are periodically significant drops in production to correct for high inventory levels.  The current inventories may necessitate  another short term drop to correct for inventories. 


Domestic consumption of cheese has seen a steady increase over 40 years.  Other countries like France still eat a lot more cheese than the U.S., so there is no anticipated ceiling for U.S. cheese consumption.  However, their is a dip in the growth rate in the last four years below.


Cheese like all other foods does have elasticity of demand.  When the prices goes up, consumption goes down.  In the last four years retail prices have increased and while consumption has continued to increase during this period, it has not increased at the pace of the last 40 years.  This has contributed to the current high inventory problem.


Cheese exports increased steadily from 2009 to 2012.  However, exports are not currently increasing.   They are currently tracking at 2012 levels when compared on a month to month basis.  Dairy export news is available at the U.S. Dairy Export Council website.


One of the factors that can significantly impact exports is exchange rates.  When the USD is weak, U.S. cheese is less expensive on the global market than cheese from other countries.  The graph below illustrates this by comparing the exchange USD/NZF rates to U.S. cheese exports. In late 2008 and early 2009, the USD gained strength against the NZD and exports fell significantly.  In 2013 there is a slight strengthening of the USD shown in blue below.  While U.S. Exports have not fallen, they have not increased as they were in the prior four years.


The review above illustrates the problem that is causing decreased Class III milk prices.  Cheese prices are falling and when the prices drop sufficiently, cheese production will be cut.

The NASS cheese prices trail the CME cheese prices by about two weeks.  While the relationship between the CME and NASS prices is not perfect, the CME is a good indicator of where the NASS prices are going.


CME daily cheese prices have risen $.16 or about 10% in the last month


Class III milk futures are reacting to the CME prices with the August Class III prices currently at $17.89/cwt. or about 10% higher the July.  The cheese inventories will continue to be closely monitored.