Tuesday, December 7, 2010

More Volatility

November Class III Milk and Component prices were announced on Friday, December 3.   Most all prices were down.


Protein, the most important element in the milk payment was down $.28/lb.  Butterfat was down $.20/lb and the Class III Milk price was down $1.50/cwt.


Graphically, the picture is equally bad.  The only increase in component prices was in other solids as a result of the increase in dry whey prices.  Other solids make a very small contribution to the milk check so this slight bit of good news has a minimal impact.


Cheese Analysis

What's behind the negative changes in Class III milk prices and protein prices is the continued high level of cheese production and the resultant high inventories. 


While cheese exports have remained strong, they have not been sufficient to keep cheese inventories at realistic levels.


Until the current high level of cheese inventory is reduced, cheese prices will remain low with only occasional upswings based on temporary issues.

Butter Analysis

The decrease in butter prices is more difficult to understand. While butter consumption is relatively stable domestically and exports are relatively strong, butter production has been off and remains low.


This of course results in lower stocks of butter which typically indicate a higher price. 


This has not been the case in the last month as butter prices on the CME and the data from NASS have shown a considerable drop.  The NASS prices for butter are still well above average as indicated by the red line on the chart below.


The biggest problem that seems to be persisting is the high inventory levels of cheese.  There is currently a lot of excellent work being done to increase exports of dairy products.  Hopefully, this work will result in significant exports of cheese that will finally reduce the high levels of cheese inventories.

Sunday, November 7, 2010

Unbelievable Month!

The October Class III milk and component prices were announced November 5.  October was an amazing month with every single parameter up over the previous month.


Protein leads the list of increases, up over 7%, which also gave the Class III price a very nice boost, up over 4%, to $16.94/cwt.

We can also be very proud of the increases in export volumes in 2010.  Exports of cheese, NFDM, and butter are all up significantly.


The CWT program announced a major policy shift in October stating their plans to drop their expenditures for herd retirements and concentrate wholly on efforts to increase dairy product exports.  There are significant funds in the CWT program, so this change which is slated to start in 2011 could be very impactful.  The press release can be read in its entirety at this link.  This is a very important change in policy.


A weak dollar is also a very important factor in expanding exports and reducing imports.  The USD has significantly softened against other currencies and with the new Fed efforts aimed at "Quantitative Easing", continued further weakness in the USD is likely.


So much for all the good news.  October prices were great and current and future efforts for expanding exports look extremely positive, but, we are still in an unusual period in terms of inventories.  Cheese stocks remain very high and butter stocks remain very low. 


Cheese stocks and their impact on cheese pricing and Class III milk prices (see the relationship explained in the April 7, 2009 post to this blog) is supply and demand driven, such that high stocks result is lower prices.  Cheese prices have already started to drop on the CME, and the NASS cheese prices will undoubtedly follow this downward trend until the surplus cheese stocks are dealt with.  This will have a short term detrimental impact on November milk protein and Class III prices.

Friday, October 1, 2010

Another Great Month

September Class III Milk and component prices were announced October 1.  It was another great month with Class III Milk prices exceeding $16/cwt.

Everything was up with the exception of milk protein and the only reason protein was down was because butter prices were so strong.  This relationship will be discussed later in this post.


The most important parameter for Class III milk prices is the NASS price for cheese.  Cheese has been on the rise since the first quarter of 2010 and has risen significantly in the last two months.  As cheese increases in price, Class III milk prices increase.


The real mover in September is butter and butterfat.  Inventories remain very tight and there seems to be no end to the increases in price.  Butter prices are now at the highest level since the current component system began in 2000 with the exception of a short period in 2004.


This reflects the very tight inventory situation which does not show any signs of improvement.  To emphasize this situation, both the running inventory levels and the annual inventory charts are shown below.  Both are based on the NASS survey data.


It seems almost certain that butter and butter fat prices will continue to rise.  While the butter prices have little impact on the Class III milk price, it does influence the component prices, increasing milk fat prices and decreasing protein prices.

The continued increase in NASS butter prices is not following the traditional pattern between CME and NASS prices.  Typically the NASS prices follow the CME prices with about a two week delay.  In the current unusual situation, while CME prices have leveled off in the past three weeks, the NASS prices are continuing to rise.


As mentioned above and in many previous posts to this blog, cheese prices really dictate the Class III milk price.  While it's nice to see the recent increases,  inventories of cheese remain very high, in contrast to butter inventories.  This really brings into question the duration of the higher cheese prices.


The inter-relationship between cheese and butter prices and the price of protein was examined in a previous post.  Butterfat is worth more when it's in cheese than when it's in butter.  This is one factor in the equations for pricing protein.  In the current situation, butter is carrying such a high value that there is very little contribution to the price of protein.  The chart below has been shown in previous posts, but is updated here to emphasize this important relationship.


The current butterfat values contribute to a very unusual pie chart of the Class III milk value.  There is more value from butterfat than from milk protein based on the September component values.


Where does this leave the milk market?  The market always follows cycles.  Butter inventory shortages will be resolved, but if history repeats itself and the correction follows the 2004 pattern, this adjustment could take a year.  During this time, butterfat prices will remain high.  The high cheese inventories will also be resolved, however, the increased pace of exports may demand a higher level than historically, so we may not see the correction to lower protein prices while cheese inventories remain high.

Friday, September 3, 2010

August Dairy Prices Announced - Everything is Up

August dairy prices were announced September 3. All the important pricing numbers were up.


First, all the good news will be analyzed and then some caution flags will be raised.

Cheese prices have returned to the highest levels since November, 2008. Cheese prices drive the Class III milk price, so it is up about the same. Cheese prices are also the main driver of protein prices, so they too benefit. Cheese prices are showing exceptional strength.


Cheese prices on the CME, which leads the NASS pricing by about 2 weeks, are currently averaging around $1.70 per lb. This is $.10 above the August NASS price for cheese, so there is good reason to expect further NASS price increases in September.


To gain perspective on Class III milk prices, the chart below shows that while these prices have not hit the highs of 2008, they have recovered significantly from the lows of 2009.


Butter prices were also up very significantly, hitting $1.85 per lb for August. Butter has not seen prices this high since 2004. Although butter prices do not have much of an impact on Class III milk prices, they do have an impact on butterfat prices.

These changes have brought the relative values of milk protein and milk fat back to a more normal balance. The chart below shows the prices since January, 2000 when the current component system was implemented.


The last 12 months can better show how the spread between fat and protein has again increased.


This has brought the pie chart of Class III milk expenditures into balance with an even spread between compensation for fat and protein.


However, there are some signs of caution. Cheese inventories remain very high.


It's a little unusual for cheese prices to have increased as much as they have while inventories remain high. To sustain the higher cheese prices, inventories must decrease.

Butter inventories remain low, which is characteristic of the high market prices being seen currently.


It's good to see the prices increased in August, however, until cheese inventories begin to be depleted, there is risk to a continuation of the stronger prices.

Sunday, August 15, 2010

What has happened to Cheese and Butter Inventories?

Currently, we have an unusual pricing scenario in dairy with very high butterfat prices and relatively low protein prices.  Prices are of course driven by supply and demand and the resulting inventory levels.  The first two graphs in this post deal with cheese and butter inventories.

Cheese inventories did not reach their normal seasonal low at the end of 2009. We are now in midyear and the midyear peak appears to be a little high, but not hugely out of line with the growing cheese markets.  The annual cycles for American cheese can be viewed on the USDA site.


Butter inventories have been extremely low, with a peak about 50 million pounds below normal levels.  A similar situation happened in 2004/5 and butterfat reached over $2.50/lb.  The yearly cycles can be viewed on the USDA site.


To better understand what is behind the inventories; below are analyses of imports, exports, net exports (exports minus imports) and production.  Cheese statistics will be viewed first and butter statistics second.

Cheese Analysis

Cheese imports are down to the lowest levels in the last 10 years.  This should help reduce cheese inventories.


Cheese exports are up significantly, more than tripling the levels of 5 years ago.  This should help reduce cheese inventories.


When exports and imports are combined, one can see that the U.S. has gone from being a net importer to being a net exporter.  This should help reduce cheese inventories.


Cheese production has remained robust.  The annual cycles can be viewed on the USDA site.  June cheese production set new high records for this month of the year.


Cheese net exports are healthy, up around 20 million pounds per month.  However, cheese production has risen between 20 and 40 million pounds per month.   U.S. consumption data is not yet available, but historically it has shown steady and predictable growth over many years.  In late 2008 and early 2009, with high milk prices, retail cheese increased enough that demand was suppressed.  With lower milk prices, the growth in cheese consumption should be continuing.

Butter Analysis

Butter imports and exports show trends similar to cheese.  Less butter is being imported....


...and more butter is being exported, although exports have not reached the heights seen in 2008.


Net butter exports (export minus imports) have reached the point of making the U.S. an exporter of butter.


But while net exports have risen by nearly 10 million tons in 2010, production has not matched this demand.  In fact, butter is down approximately 10 million tons.  The annual cycles can be viewed at the USDA site.


Consumption of butter has been very steady for many years, so no change in consumption is expected.

In summary, the changes in inventories can primarily be linked to production which is out of sync with demand.  This will no doubt reverse itself, but for now has created an unusual supply and demand situation that will take months to correct.

Sunday, August 8, 2010

The Math Behind Milk Protein and Butterfat Pricing

We are in an unusual period in milk component pricing.  Butterfat's value is increasing significantly and the price of milk protein is dropping significantly, yet the Class III milk price has barely moved (see last week's post).  This post will examine the math behind this scenario.

The formulas for milk pricing are available on the USDA web site.  We'll examine the simple formulas first.

Butterfat

Butterfat Price = (Butter price – 0.1715) x 1.211

This formula is very straightforward.  The butter price is reduced by the cost to make butter (the "make allowance") and then multiplied by the ratio of how much butter can be made from a given quantity of butterfat.  The relationship is very direct, as the price of butter goes up, the price of butterfat goes up.


Other Solids

Other Solids = (Dry Whey Price - .1991) x 1.03

The pricing of "other solids" is similarly straightforward.  It is based on the dry whey price less the cost to make dry whey multiplied by the amount of dry whey that can be made from "other solids".  The only uniqueness to "other solids" is that because whey is very inexpensive, the cost to dry and prepare dry whey can be greater than its market value and when this happens the value of "other solids" become negative.


Milk Protein 

Protein = (cheese price - .2003) x 1.383
+ (((cheese price - .2003) x 1.572) - butterfat price x .9) x1.17

The first line of the protein price follows the logic of the "butterfat" and "other solids" formulas.  However, the second part shown on the second line above gets  more complex both conceptually and mathematically.  The second half of the formula gives a value to the increased value of butterfat when it is used in cheese as opposed to butter.  This is the part of the formula that can shift the value between butterfat and milk protein without much impact on the overall Class III price.

This relationship will be illustrated in the following graphs.

When the price of butter is constant and the cheese price increases, then the protein price will increase.


However when price of cheese is constant and butter increases in value, the price of protein decreases.


When Cheese goes up within its normal variation and butter decreases in it's normal variation, the price of protein will reach peak values.


When cheese and butter both increase within their normal variations, protein will increase in value, but not as reach high a price as when butter is low.


The Class III prices are really only impacted by cheese prices.  We have examined this in previous posts to this blog.  Graphically, this can be visualized as follows.

When cheese prices increase significantly, Class III prices increase significantly.


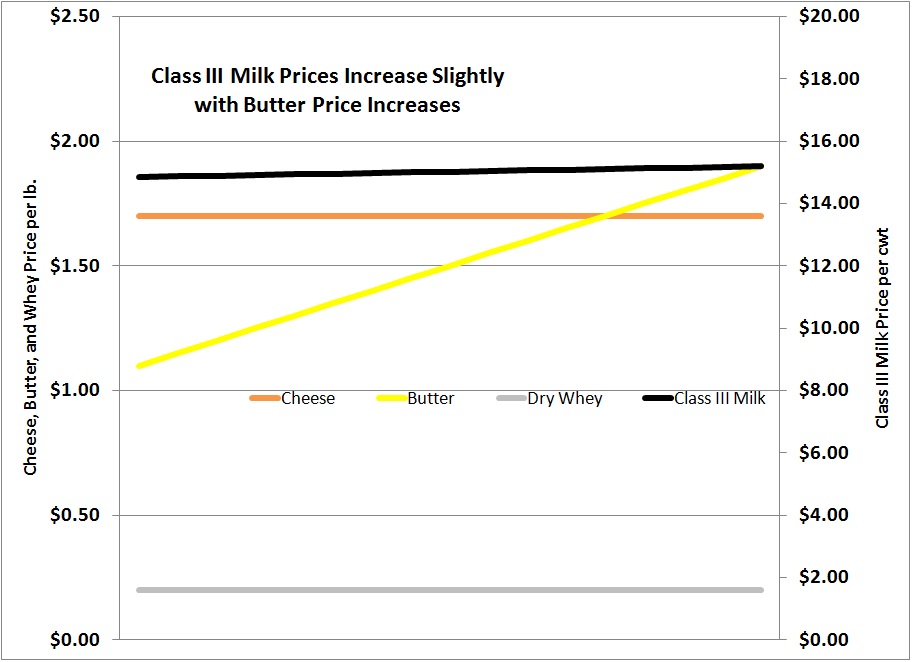
However, when butter prices increase significantly, the class III price barely changes.


When cheese is increasing and butter is decreasing, the Class III price largely ignores the change in butter prices.


When butter and cheese both increase to their historic highs, the Class III price will reach its highest, but that high is close to the high when just cheese prices are high.


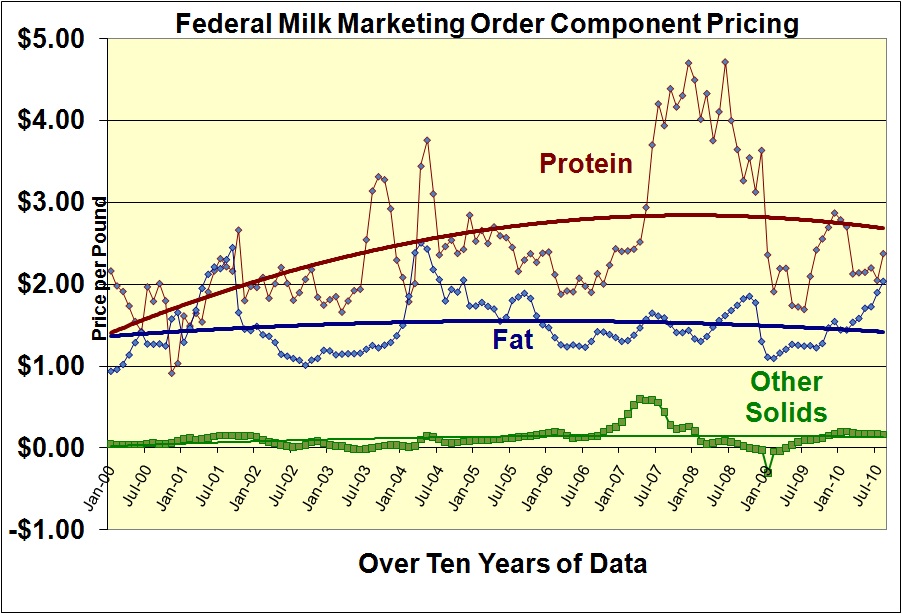
In 2010, we have experienced a period where butter prices are significantly up and cheese prices are significantly down.  This has created a big shift in the relative values of butterfat and milk protein.

The Class III price has followed only the cheese price.


The chart below shows the two parts of the protein formula separately.  While the price of cheese has had only slight variation, the value differential for butterfat in cheese vs. butter has reduced the protein price by nearly $.60.


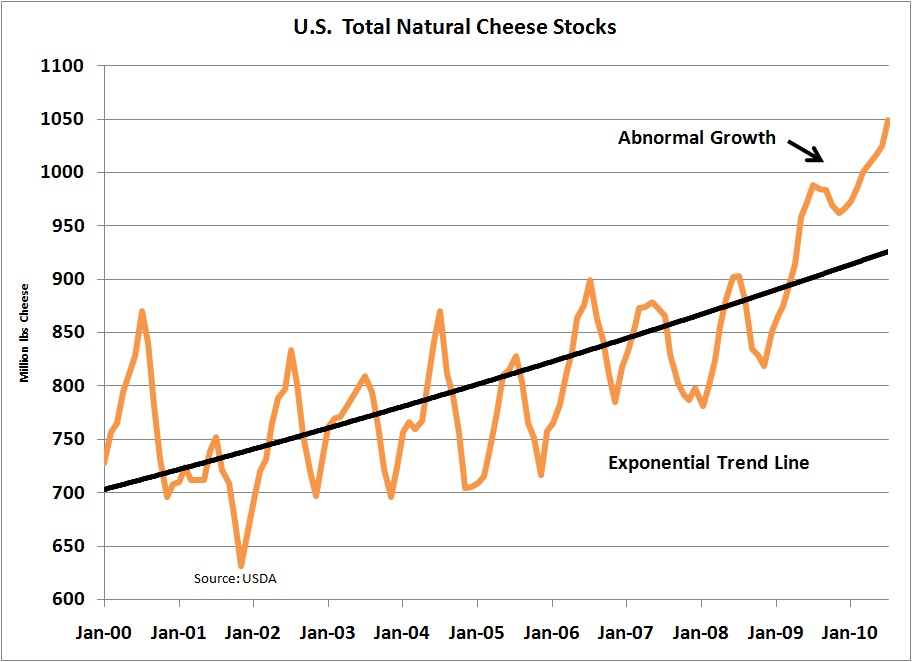
The inventories of butter remain very tight.  Therefore, we can probably expect butterfat to command very high prices for the foreseeable future. 

The inventories of cheese however are coming more in line with historical levels and we can probably see an increase in Class III prices and the value of protein as this occurs.