Producer prices for milk are high. Why are they high? Will they stay high? This post is the first of two posts which will examine the current high producer milk prices. It will cover the pricing of the four Classes of milk, milk component prices, and the prices of commodities used to price components. The reasons behind the high commodity prices will be covered in the next post.
Chart I below shows the component prices of the three components, butterfat, milk protein, and "other solids" that are used to price Class III milk, the largest Class of milk. Nonfat dry milk is used to price Class IV skim and will be covered separately.
Toward the end of the chart, butterfat has again surpassed milk protein in value. January 2022 butterfat is worth $2.96 per pound and milk protein is at $2.36 per pound. The high butterfat prices are a strong incentive to produce higher levels of butterfat.
"Other solids" are presently worth $.52 per pound. While that price is small, compared to the value of butterfat and milk protein, the current "other solids" price is the highest since mid 2007. There is also nearly twice the amount of "other solids" compared to the volume of milk protein or butterfat. The current high prices for "other solids" are a factor in the current high milk prices.
 |
| Chart I - Milk Component Prices |
The milk component values just discussed are calculated from the wholesale prices of three commodities: cheese, butter, and dry whey.
CHEESE
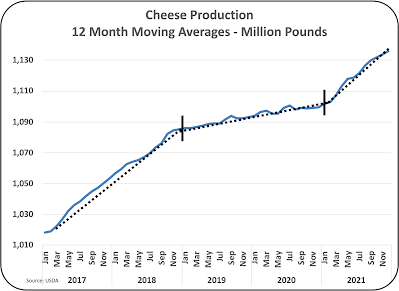
Chart II below shows the value of cheese from 2014 to January 2022. The current price of cheese is $1.90 per pound. As can be seen in the chart, $1.90 is a good price, somewhat above the average, but not extremely high. The reason for high cheese prices is usually low cheese inventories. Wholesale inventories will be covered in the next post.
The cheese price calculated by the Agricultural Marketing Service (AMS) is based strictly on the wholesale price of young Cheddar cheese.
 |
| Chart II - Wholesale Cheddar Cheese Prices |
BUTTER
Butter prices (Chart III below) are extremely high, hitting near record levels. This is keeping the butterfat prices very high and above milk protein prices. High butter prices are usually the result of low wholesale inventories of butter. By the USDA formulas, high butter prices decrease the value of milk protein.
 |
| Chart III - Wholesale Butter Prices |
DRY WHEY
"Other solids" pricing is based on the price of dry whey. Dry whey is primarily an export item. The value can be very volatile as is always the case with export markets. Dry whey prices are at record highs.
 |
| Chart IV - Wholesale Dry Whey Prices |
NONFAT DRY MILK
There is one other commodity that is used in pricing producer milk and that is nonfat dry milk (NDM). The price of NDM is used to price Class IV skim milk. It is the only commodity that impacts the price of Class IV skim milk. Because the price of Class IV skim milk is used to price Class II skim milk and is now also used to partially price Class I milk, it is important in overall milk pricing. The current price of NDM is not a record, but it is the highest price since 2014.
 |
| Chart V - Wholesale Price of Nonfat Dry Milk |
The remainder of this post will cover the four Classes of milk, calculated from the prices of the four components reviewed above. They will be reviewed in reverse order beginning with Class IV.
Producers are paid based on the weighted average of the four Classes of milk in their Federal Order. The first payment is based on the components delivered. The Producer Price Differential will then be used to average the prices of the four classes.
CLASS IV MILK
Class IV milk is priced on only two things, NDM for pricing the skim, and butter for pricing the butterfat. Therefore, the Class IV skim prices shown in Chart VI below exactly follows the NDM price shown above in Chart V.
The full Class IV price (Chart VII) includes the skim milk price and the butter price shown in Chart III above. Because both are at highs, the Class IV milk price of $23.09 per cwt. is a high not seen since 2014. It is also the highest of the four Classes of milk.
 |
| Chart VI - Class IV Skim Milk Prices |
 |
| Chart VII - Class IV Milk Prices |
CLASS III MILK
Class III skim milk price (Chart VIII) is not at a high. "Other solids" are at a high, but do not contribute a lot to the Class III skim milk price. The high butter prices reduce the value of milk protein. (See this prior post to this blog to review the formulas.) Therefore, the Class III skim price is at a decent price point but not extremely high. It is the lowest of the four milk Classes.
Chart IX below shows the full Class III price. With the high butterfat prices, the overall Class III price is at a high. There were two spikes in 2020 for Class III prices, but they were only temporary issues caused by COVID. At $20.38 per cwt., Class III milk is the lower priced than Class II and Class IV milk.
 |
| Chart VIII - Class III Skim Milk Prices |
 |
| Class IX - Class III Milk Prices |
CLASS II MILK
Class II milk is small in quantity, but it is seeing high prices. The Class II skim milk price (Chart X) is the advanced Class IV skim milk price plus $.70, so it is following exactly the NDM and Class IV skim patterns.
The full Class II milk price in chart XI is high because of the extraordinary high NDM and butterfat prices.
 |
| Class X - Class II Skim Milk Prices |
 |
| Chart XI - Class II Milk Prices |
CLASS I MILK
Class I skim milk prices (Chart XII) are based on a 50/50 mix of Class III and IV skim milk prices plus $.74. The value of Class III skim milk is down, and Class IV skim milk is up, so the Class I average for skim milk is good, but not at record-breaking levels.
The base price of Class I milk is $19.71 per cwt. for January and $ 21.64 per cwt. for February, a high not seen since 2014 and primarily due to the high butterfat prices.
 |
| Chart XII - Class I Skim Milk Prices |
 |
| Chart XIII - Class I Milk Prices |
WHERE DOES THAT MEAN FOR PRODUCER MILK PRICES?
As of the start of 2022, all four classes of milk are above or near $20 per cwt. This has not happened since 2014.
Three of the four commodities used to price milk are at or near record prices. That includes butter, dry whey, and NDM. Cheese is at a high, but not record setting.
Disappearance from wholesale inventories of butter and cheese, are dominated by domestic consumption. The remaining two, NDM and dry whey, are dominated by exports and international prices. In the next post, production, inventories, and disappearance of these commodities will be examined to see why they are high priced.