Sunday, November 27, 2022

Is Plant-Based "Milk" Cannibalizing Dairy Milk?

Plant-based "milk" sales are growing.  Plant-based milk typically has shelf space beside the dairy milk in the refrigerated section of stores and the space rivals the space for dairy milk.  While dairy milk continues to decline, plant-based milk is growing.  Is the growth of plant-based milk cannibalizing the dairy market for milk?  If so, how much is it cannibalizing?

This post will cover the facts in the growth of plant-based milk and where it may be heading in its competition with dairy milk sales.  It will also cover the impact of plant-based milk sales on butter production.

Much of the published literature uses dollar value as the common denominator in comparing dairy and plant-based milk sales and gives plant-based milk a 16 percent market share.  This published data is based on dairy and plant-based milk sales at 2021 prices.   With inflation and competition. those numbers have changed significantly.  Plant-based milk is still more expensive than dairy milk, but the pricing difference has narrowed.  Consumers do not drink dollar values. That is why the data used in this blog post is based on sales volume in pounds, not dollars.

Charts I and II below are stacked graphs with the dairy milk on the bottom and the plant-based milk on the top.  Both charts plot sales in billions of pounds.  Chart I covers the actual data from 2013 to 2021.  In 2013, plant-based milk had just two percent of the total volume of dairy and plant-based sales.  With a decline in dairy milk and growth in plant-based milk, by 2021 plant-based sales had doubled to 4.1 percent of the total.

Chart I - Sales of dairy and plant-based milk products.

Statista made projections of the increase in plant-based milk through 2026.  Chart II covers the period through 2026 with the Statista projections for plant-based milk and a continuing decline in dairy milk sales of two percent annually.  With these assumptions, plant-based milk will make up 5.8 percent of total milk in 2026.

Chart II - Sales of dairy and plant-based milk
with projections through 2026

In terms of plant-based products, almond milk is the clear leader with a 58 percent market share.  Commercial growth of almonds is exclusively in California.  The almonds or the almond milk must travel a considerable distance to blanket the U.S.  Oat milk is second with a 17 percent market share.  In 2022, almond milk lost some market share and oat milk gained market share.  Together almond and oat milk make up 75 percent of plant-based sales.  

Why do people spend more for plant-based milk?  Why do they switch from dairy milk?  Why do the majority stick with dairy milk?  What are the key factors in deciding between dairy and plant-based milk?

There are quite a few elements that entice milk buyers to buy plant-based milk or stick with dairy milk.  

  • One factor is lactose intolerance.  There is lactose treated dairy milk that contains the enzyme that can break down lactose for digestion.  It is primarily available in whole milk and two percent fat milk.  There is no lactose in any plant-based milk.
  • Dairy milk does contain cholesterol.   Plant-based products do not contain cholesterol.  
  • Shelf life is another factor that favors plant-based products.  They are typically labeled with an expiration date that is longer than dairy milk.  Part of that is the limited fat or no fat in most plant-based milks. Dairy milk can develop off tastes more quickly.
  • Plant-based milk is higher priced than dairy milk.
  • One of the drawbacks to plant-based products is the lower protein content and lower quality protein.  If a person is buying their milk for protein, dairy milk is the clear winner.

Is plant-based milk taking market share from dairy milk?  Where is it coming from?

Annual U.S. milk sales of skim milk have decreased by 4400 million pounds since 2013.  Annual plant-based milk has increased by 929 million pounds to 1979 million pounds per year during this same period.  

Whole and two percent fat milk have decreased by less than one percent per year over that last 10 years (Chart III).   In total, dairy milk has decreased by two percent per year over the last 10 years.  The main loss in dairy milk is in skim and to a lesser extent, one percent fat milk.

Chart III - Milk Sales by Butterfat

How does this impact butter churning?

Over 10 years, skim milk sales have decreased by 5000 million pounds per year and one percent milk has decreased by 2500 million pounds per year.  As a result of the decreasing sales, there is less butterfat that is removed from this milk, and it amounts to over 250 million pounds of butterfat annually at 2021 production levels.  

This amount of butterfat would produce over 300 million pounds of butter annually. In 2021, slightly over two million pounds of butter were produced in the U.S.  The loss in butter churned from butterfat that is no longer available from skim and one percent milk is about 15% of annual butter production.  Why do we have a butter shortage?  This certainly plays a part!

With the continued increase in plant-based milk and a decrease in low fat milk, the available butterfat will continue to decrease.  It appears that sales of plant-based milk is partially responsible for this decrease.

Summary

Plant-based milk is cannibalizing dairy milk sales and it is coming primarily from skim and one percent fat dairy milk.

The decrease in dairy milk sales is reducing the amount of butterfat available for churning butter.  In turn, this is contributing to shortages in butter churning and the resulting high prices for butter and butterfat.


Tuesday, November 15, 2022

De-pooling in the Upper Midwest has Shot Up!

The May 2009, post to this blog covered de-pooling in the Upper Midwest.  A lot has changed in 13 years.  Charts I and II below show the comparison of 2009 and 2022 (the last 12 months ending in September 2022). The Upper Midwest is still primarily a Class III milk for cheese Federal Order.  However, the swings in Class I milk and de-pooling are huge.

Class I milk cannot be de-pooled, but all other milk can be de-pooled from the Order.

In 2009, Chart I, the Upper Midwest produced over 34 billion pounds of milk.  Of that total, two billion pounds were de-pooled.  Class I milk was in second place making up 15 percent of the pooled milk or 13 percent of the total milk.  Class III milk made up 77 percent of the pooled milk.

Chart I - Pooled Milk Marketed in the Upper Midwest in 2009

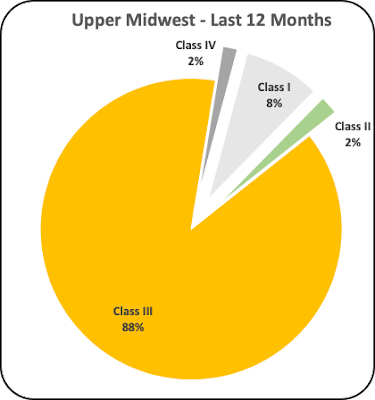
By 2022 (Chart II), 47 billion pounds of milk were produced, and 19 billion pounds of milk were de-pooled.  Class I made up only eight percent of the pooled milk or just five percent of the total milk produced.  Class III milk made up 88 percent of the pooled milk.

Chart II  - Pooled Milk Marketed in the Upper Midwest in
the most recent 12 months  

From 2005 to 2009, nine percent of the milk was de-pooled (Chart III).  In many months, no milk was de-pooled.

Chart III - Pooled and De-pooled Milk in the Upper Midwest

From 2018 to 2022, 40 percent of the milk was de-pooled.  In some months nearly 80 percent of the milk was de-pooled.  There were no months where no milk was de-pooled.

Chart IV - Pooled and De-pooled Milk in the Upper Midwest.

Why has the percent of de-pooled milk increased so much?  De-pooling typically occurs when the value of Class III or Class IV milk is higher priced than the "Uniform" or average price of the four classes of milk.  The de-pooling causes a lower or negative Producer Price Differential (PPD).  Below are some of the reasons that there is more de-pooling.

Less Class I milk lowers the Uniform price.

The current payment system was developed in the late 1900s and implemented January 2000. At that time Class I milk was the largest category of milk and the system was designed to keep Class I milk priced above the other classes.  With less high-priced Class I milk, the Uniform price will be lower.  

Chart V shows the percent of Class I milk in the Upper Midwest Federal Order.  It is well known that consumption of fluid milk is declining.  From 2005 to 2022 the percent of Class I milk in Upper Midwest declined very significantly from an average of 17 percent to just 5 percent. The decrease is a result of two factors, less Class I milk is being produced and more Class III milk for cheese is being produced.  It is a trend that is long-term, and it will continue and therefore, its impact on lowering the Uniform price is definite and will continue.

Chart V - Upper Midwest Percent of Class I Milk
(Includes Pooled and De-pooled Milk)

With less Class I milk, the average PPD has decreased by over $.10 per cwt.  Chart VI below lists the PPD from 2005 to the present.  PPDs that occurred during COVID are not shown as they were very abnormal.

Chart VI - The Upper Midwest PPD

De-Pooling Rules

De-pooling rules have not changed much.  De-pooling rules are unique to each Federal Order. The Upper Midwest can divert 90 percent of the milk delivered to a non pool plant and include it in the Federal Order pool.  This provides a lot of flexibility in de-pooling decisions 

Today, de-pooling is consistent monthly.  Some appears to be a routine process. 

WHAT DOES THIS MEAN TO DAIRY PRODUCERS?

What happens to producer prices when there is de-pooling.  De-pooling does not create more funds for producers. It only shifts the money around.  A simulation was made using data from January 2021.  There was a lot of Class III de-pooling in that month.  The PPD for the pooled milk was a negative -$.92 per cwt.  Those that de-pooled were paid more because they could avoid the negative PPD.  If the total volume of milk was pooled, assuming that those that de-pooled milk were paid at Federal Order rates, the negative PPD would be much lower.  If all the milk was pooled, the PPD would have been a negative -$.21 per cwt.  

By de-pooling, the additional money that moved to the pockets of those that de-pooled amounted to over $7 million in one month. Those that remained in the pool, paid the $7 million due to the high negative PPD of -$.92 per cwt.

Sunday, November 6, 2022

Are Producers Taking Advantage of High Butterfat Prices?

Butter and butterfat prices continue to escalate hitting record levels.  Are producers taking advantage of these high prices to increase revenue?  Technologies to increase butterfat in milk are known and many producers are taking advantage.  Genetics, feed, and diets balanced for amino acids can boost butterfat.  This post will cover where the U.S. stands in implementing the technologies to increase butterfat.

Table I lists the Federal Orders ranked by their percent butterfat calculated as 12-month moving averages.  Butterfat percent decreases in the heat of summer and 12-month moving averages eliminates this volatility.  Table II lists the Federal Orders by their improvement in the last 12 months.  There are no negative statistics in either table!

Does a high butterfat price encourage producers and their nutritionists to take steps to increase butterfat?  The answer is a clear YES.  By comparison, butterfat percent in milk increased by .07 percent in the last year while milk protein increased by .04 percent in the same time frame.  In 2020, as butterfat prices declined, butterfat percent increased by only .02 percent.

There are huge differences in butterfat production geographically.  The best in 2022 is the Pacific Northwest Federal Order with 4.24 percent butterfat.  The lowest is Florida with 3.67 percent butterfat, 13 percent lower than the Pacific Northwest. 

Table I - Butterfat Components by Federal Order
Listed by their 2022 Butterfat Percent

In terms of improvement, the Pacific Northwest again ranks at the top of the list and Florida ranks at the bottom.  Some that are ranked near the top in Table I, like the Southwest and the Upper Midwest have made only minimal to average improvements in 2022.  Because the gains and standings vary significantly, that leaves room for improvements in many areas.

Table II - Butterfat Components by Federal Order 
Listed by their Annual Improvement,

There is high demand for butter and inventories are low and prices are high (Chart I).  Butterfat is priced based on the wholesale price of butter.  The 12-month moving average of butterfat prices have been hitting new record highs every month.  With better prices, the percent of butterfat has increased above the trend line as producers react to the higher prices.  The overall improvement in butterfat is steady and is currently accelerating.

Chart I - Butterfat Percent and Price

The next four charts provide detail on four of the Federal Orders with unique and positive butterfat production.

California is ranked second behind the Pacific Northwest in growth in the last 12 months.  Chart II shows the gains made by California, up .12 percent in the last year.  California is the largest dairy state and the largest butter producing state.  Their improvement in butterfat helps the overall average, currently at .07 percent.  For more details on California butter production click here

Chart II - California Butterfat Percent

The Southwest Federal Order stands out in most all comparisons.  They rank second behind the Pacific Northwest in their butterfat content at 4.14 percent.  Unfortunately, since the beginning of 2022, there has been no improvement.

Chart III - Southwest Butterfat Percent.

The Southeast Federal Order is one of the four Federal Orders paid on the advanced system.  The other three are all ranked at the very bottom in Tables II.  The Southeast Federal Order has been able to increase butterfat by .07 percent and ranks in fourth place in improvement (Chart IV).

Chart IV Southeast Butterfat Percent

Starting 2021 and continuing through 2022, the Upper Midwest has increased butterfat.  Over the two years of growth, the Upper Midwest has increased butterfat from four percent to 4.09 percent.  This ranks the Upper Midwest at third place behind only the Pacific Northwest and the Southwest.  Prior to 2021, there was very little growth in butterfat percent (Chart V).

Chart V - Upper Midwest Butterfat Percent

Producers in all Federal Orders are paid for butterfat.  Butterfat is in very short supply and butterfat prices are at record highs. The companies that can help producers and their nutritionists to increase butterfat have a very strong window of opportunity with the extremely high butterfat prices.  The prices will likely begin to decline in 2023 but for some time will still provide a healthy ROI that will enhance a producer's revenue and finances.