Sunday, January 12, 2014

Year End Inventories and Exports

When the prior post was released, inventory and updated export data for November was not available.   This post will review the current information now available.  In summary, inventories are at reasonable to low levels and exports are strong.  This has provided a strong basis for 2014 milk pricing.  Class III futures are in excess of $20/cwt. for January and February 2014.

INVENTORIES

Beginning with the largest and most important product, cheese, the two charts below show the current level of natural and American cheese stocks.  Cheese prices are the primary element in the Class III milk pricing formula.  High inventories can result in reduced prices, which were a concern in early 2013.  By November,  the inventories have fallen to reasonable levels, just above the levels for 2011/12 for this time of the year.  The November NASS price for wholesale cheese was $1.88/lb.  This was not even near to the price level spikes of 2004, 2008, and 2011, so the price does not indicate any type of disruptive bubble.


In the prior post, the December jump in price for butter and butterfat was discussed.  In early 2013, there was concern that the high inventories would cause butter prices to fall.  There is no such concern presently.  The NASS price for butter in December was $1.63/lb.   That is a good price, but not near the past highs.  There is no indication of a bubble in the price of butter.  The futures market prices indicate that slightly higher butter pricing is expected.


The other two items important to Federal Order Pricing are dry whey and nonfat dry milk.  Dry whey pricing is used to calculate the price of "Other Solids" and nonfat dry milk is used to calculate the Class IV milk price.


Whey inventories are significantly above 2011/12 levels and the current pricing for dry whey and "Other Solids" reflects this.  In December of 2012, "Other Solids" were worth $.48/lb.  In December 2013, "Other Solids" were worth $$.38/lb.  "Other Solids" have been contributing nicely to the Class III price and the inventory levels and pricing are a concern.

As mentioned above, nonfat dry milk pricing is the basis for the Class IV milk price.  The Class IV milk price has been extremely good as was reviewed in the prior post to this blog.  The majority of nonfat dry milk is exported so pricing is dependent on international prices.

EXPORTS

Exports through November remain excellent.  Cheese exports reached an all time high in November.   Domestic consumption makes up 94% of cheese disappearance and export volume is only 6.  This presents an opportunity for growth through increased exports.


Surprisingly, butter exports fell.  Butter production was lower which helped keep the inventories low.  Even though the exports fell, they still represent a record high for the month of November.


EXCHANGE RATES

Exchange rates remain positive for U.S. exports.  The two charts below show the USD exchange rates against the two other major dairy export currencies, the Euro and the New Zealand Dollar.  The USD/Euro chart shows that the USD has weakened in 2013 making U.S. dairy products less expensive in the global markets.


The New Zealand Dollar is currently near the average exchange rate for 2013.  And compared to four years ago, the USD is significantly weaker.


Going into 2014, the state of the U.S. dairy industry looks pretty good.  Stocks of dairy products are in line, exports are strong, and future pricing is positive.  All of these factors will continue to be followed in this blog in the upcoming months.

Sunday, January 5, 2014

2013 Ends With a New Class III High

On January 2, 2014, the December 2013 Class and Component Prices were announced.   The Class III price was up slightly to $18.95/cwt.  Butter pricing increased by 7.3% vs. November, bringing butterfat prices up 8.2% to $1.77/lb.  Nonfat dry milk increased to $1.95/lb., near an all time record.


Cheese prices were up slightly in December, but milk protein prices still fell.  The spike in butter prices has caused the lowering milk protein prices.  See the August 8, 2010 post to this blog for an explanation of this relationship.


Protein payment made up 56% of the value of December Class III milk, but this was down from the prior month.  The prior month payment for milk protein made up 68% of the milk check which was a record.  The higher price for butter has increased the payment for butterfat while decreasing the payment for milk protein.

Inventory data for December is not yet available but an analysis of inventories and exports will soon be posted to this blog. 

Nonfat Dry Milk

The price of nonfat dry milk is not typically a discussion point for those paid on components.   Nonfat dry milk pricing does not affect the Class III price in any way.  However, it does impact the payment to producers paid on the Class III component basis, which is the majority of U.S. dairy producers.  This apparent contradiction is explained below.

Nonfat dry milk is the basis of the Class IV milk price.  

Class IV Skim Milk Price = Nonfat Solids Price x 9 

Nonfat solids pricing is calculated from the nonfat dry milk price as shown below.

Nonfat Solids Price = (Nonfat Dry Milk - 0.1678) x 0.99 

As reported in a prior post to this blog, strong exports of nonfat dry milk and the international value of nonfat dry milk have created an environment which is setting a five year high for U.S. nonfat dry milk prices. The pricing of nonfat dry milk is shown below.  Over the last four years, pricing has nearly doubled.


Therefore Class IV milk prices are also setting records.  Starting in February 2013, the Class IV price of milk has been higher than the Class III price.  The difference between the Class III price and the Class IV price continues to increase and is currently $2.59/cwt.


The formula for the Class I Skim Milk price is based on the higher of the Advanced Class III or IV, so when the Advanced Class IV price is higher, which it currently is, the advanced Class IV price will really determine the the Class I price.


Base Skim Milk Price for Class I = Higher of Advanced Class III or IV Skim Milk Pricing 

The Class II Skim Milk price is always determined by the Advanced Class IV price.


Class II Skim Milk Price = Advanced Class IV Skim Milk Pricing + $.70

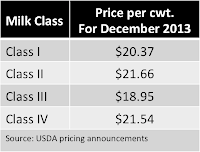
The bottom line impact is that the nonfat dry milk price is now driving the Class I, II, and IV milk prices.  For the month of December, the comparative prices for Class I, II, III, and IV are as shown in the table below.


The price of Class IV milk is currently higher than Class I and Class III milk and close to the Class II price.  This is a drastic change from the norm.  The same Class pricing for December 2012 is shown below for comparison.


The December 2012 pricing is more typical with Class IV milk as the lowest paid Class.  A strong export market with good pricing drives the current situation.

How does this impact the majority of U.S. producers who are paid on the component system?  The Producer Price Differential is based on a comparison of the Class III price to the weighted average of all classes.  Therefore, the Producer Price Differential will be higher because the Class III price is currently the lowest paid.  And because of this, there will be less de-pooling of milk especially in the Upper Midwest.

Inventory data will be reviewed in an upcoming blog post when the data is available.