Sunday, December 16, 2018

October Dairy Export/Import Data is Now Available.

October Dairy Export/Import data was recently released.   The most positive category sector is exports of Nonfat Dry Milk/Skimmed Milk Powder (NDM/SMP.)  NDM/SMP export volumes for 2018 remain very high, with most of the product going to Mexico.  Exchange rates were also generally positive with a weaker USD.  Other export data was not so positive.  The four export products analyzed below are those that impact dairy producer milk prices; cheese, butter, NDM/SMP, and dry whey.  The emphasis in this post will be net exports (exports-imports).

Cheese net exports (Chart I), are a very important as they impact inventories and cheese inventories control the price of producer milk (see prior post).  Cheese net exports for October are almost exactly at the level of 2014 and 2017 and somewhat above 2015 and 2016.

Chart I - Cheese Net Exports
 Cheese imports are typically strong in the final quarter of the year as specialty cheeses are imported for the year-end holidays (Chart II)

Chart II - Cheese Imports
Chart III shows where these imported cheeses come from, which are primarily from Italy and France. This shows the impact of specialty cheeses during the holiday season.  By comparison, most all U.S. cheese production is commodity cheeses.
Chart III - Imports of Cheese by country
Butter exports and imports show a similar situation.  Butter Imports are growing (Chart IV) and will likely continue to increase.

                           
                               Chart IV - Butter Imports

Irish butter, which is cultured, has gained a significant position in the U.S. market (Chart V) as well as other international markets.  The concept of a "different" butter with unique characteristics was refined, branded, and marketed, and has had a major impact on Irish dairy exports.   The Irish dairy cooperatives have led the effort.

Chart V - Butter Imports by Country
As a result, butter net exports (Chart VI) remain near zero.

Chart VI - Butter Net Exports
NDM/SMP is the bright spot in dairy exports.  Net exports of NDM/SMP have been setting records most every month in 2018.  And, the records being set are significant gains (Chart VII).

Chart VII - NDM/SMP Net Exports
Exports of NDM/SMP have set new records in all but one month of 2018 (Chart VIII).
Chart VIII - NDM/SMP Exports
More than half of the exports of NDM/SMP are going to Mexico (Chart IX).  It is a perfect product for areas that lack refrigeration and need low cost good nutrition products.
Chart IX - NDM/SMP Exports by Country
Imports of NDM/SMP are at a low.  In September they were at a five-year low and were near a five-year low in October.
Chart X - Imports of NDM/SMP
The imports are coming primarily from Canada at low prices.  Due to increased butter consumption in Canada, there is a glut of skimmed milk which can be converted into NDM/SMP.  New Zealand has also been selling low priced NDM/SMP in the international markets.
Chart XI- Imports of NDM/SMP by Country
The final product to be reviewed is dry whey, which is the basis for pricing Other Solids.  While exports are low, inventories are also low (see prior post).  Not all whey is dried, and a significant amount is feed to animals in a wet form.  This helps keep inventories in balance and therefore even with low exports, the price of dry whey is reasonable. 
Chart XII - Exports of Dry Whey
Exchange rates are currently moving in a favorable direction for exports. Only the exchange rate with New Zealand showed a stronger USD. A weaker USD makes U.S. products more competitive in the international markets.  The four charts below represent the two largest dairy competitors in the international markets, the EU and New Zealand, and the two largest U.S. dairy export markets, Mexico and Canada.  
Chart XIII - Exchange Rates USD/Euro
Chart XIV - Exchange Rates USD/NZD

Chart XV - Exchange Rates USD/Mexican Peso
Chart XVI - Exchange Rates USD/CAD
The USDEC should be congratulated on a positive 2018 for dairy exports.  The challenge in 2019 is to increase exports of cheese to help reduce inventories and improve producer prices.


Sunday, December 9, 2018

Inventories Control Producer Prices


November Class III milk and Component prices were released on December 5.  Milk protein and the Class III milk price were down considerably, and butter and butterfat were down slightly.  The Class III price fell to $14.44/cwt., about 7% lower than the prior month and 14% lower than November 2017.
Chart I - Monthly Gains of Loses Compared to the Prior Month
The Class III price remains within the tight pattern it has been in for the last four years.  (See the November  11 post for more details on the "new normal."   The data for the last four years shows no significant trends for improvement.  The November price of $14.44/cwt. is in the lower quartile of prices over the period from January 2015 to the present.
Chart II - Class III Milk Price Since January 2015
What is driving the low milk price is the high inventory of cheese being carried.  For the linkage between the cheese price and the Class III milk price see the prior post.  A case could be made that cheese prices could be worse based on current inventory levels.
Chart III - Cheese Inventories by Year
The long-term cheese inventory levels are shown in Chart IV.  The trend line can be used to compare the current inventory levels to the "appropriate levels" represented by the trend line.  The growth of cheese inventories above the trend line is obvious.  A case can be made that the cheese inventory levels are in the neighborhood of 50 million pounds too high.  If changes are not made, it will continue to grow.
Chart IV- Cheese Inventory Compared to Growth Trend Line
As reviewed in prior posts, exports of cheese are not growing.  While there may be some impact from the current tariffs on cheese exported to Mexico, that impact could not begin to match the 50-million-pound bulge in inventories.  Production is simply too high, and that production is being pushed by too much milk.

Butter prices remain in the higher level established starting in 2015.  For 2018, butter has traded in a very tight pattern, ranging from $2.11/lb. to $2.38/lb.  The current price of $2.27/lb. is near the midpoint of the four-year and one-year range in butter prices.  There was a very slight downturn in the butter price from the prior month which had very little impact on overall pricing.
Chart V - Butter Pricing since January 2000
Butter inventories remains very close to the prior year in spite of the growing consumption of butter.  The tight inventories remain very close to prior years.  The tight inventories are keeping butter and butterfat prices high.
Chart VI - Butter Inventory Year by Year
The Class IV skimmed milk price is derived from the price of Nonfat Dry Milk/Skimmed Milk Powder (NDM/SMP).  NDM/SMP increased slightly in price (Chart VII).  This resulted from the continuing drop in inventories of NDM/SMP (Chart VIII).  
Chart VII - NDM/SMP Prices
Chart VIII - Inventory of NDM/SMP
While the current price of NDM/SMP is still in the low-price range for NDM/SMP, it did increase the Class IV price enough to make it higher than the current Class III price (Chart IX). When the advanced Class IV skimmed milk price is above the Class III skimmed milk price, the Class IV price is used as the basis for Class I milk pricing.  This in turn increases the uniform milk price and Producer Price Differentials and provides slight benefit for producer prices.
Chart IX - Class III and Class IV Milk Prices
The price of Other Solids is calculated based on the price of Dry Whey.  Dry Whey inventories dropped in March of this year and have remained low throughout the year (Chart X.)  
Chart X - Dry Whey Inventory
The price of Other Solids has increased from a low $0.06/lb. in early 2018 to $0.27/lb. in November.  This has changed significantly the makeup of the Class III price (Chart XI).  In November, Other Solids made up 11% of the Class III price.  In January 2018, Other Solids made up only 3% of the Class III price.
Chart XI - Component Contributions to the Class III price. 
Behind all of the price changes analyzed above, the level of inventories has been the primary cause.  The biggest problem facing producer prices is the huge high inventory of cheese.  Producer prices cannot be improved until actions are taken to reduce the cheese inventory.

Monday, November 19, 2018

Cheese Exports Fall

Export/import data is now available through September.  This post will deal exclusively with cheese analytics.  Cheese prices are linked very closely to the Class III milk price.  This is illustrated in Chart I and the math behind this tight correlation can be viewed in the April 15 post to this blog.  The data behind Chart I show a 96% correlation between the price of cheese and the price of Class III milk.  That means that 96% of the fluctuations in the Class III price can be predicted by the cheese price.

Chart I - Correlation Between the Cheese Price and the Class III milk Price

Because the price of cheese has been stagnant for the last three plus years, the price of producer milk has also been stagnant as covered in the prior post.  The low price of milk is directly caused by the low price of cheese, and the low price of cheese is caused by the high inventories, which will be covered later in this post.

There are three elements that control the size of cheese inventories, domestic consumption, which is very predictable, cheese production that is covered later in this post, and cheese exports.  Chart II shows cheese exports by month over the last 18 plus years.  After a steady climb for 14 years, cheese exports have been stagnant.  While there could be some impact from the newly implemented Mexican tariffs, the stagnant pricing covers a much longer period.

Chart II - Cheese Exports for the Last 18 Years
Chart III below shows the cheese exports for the last five years on a year-by-year basis.  For the last two months, the cheese exports have been below the prior year and for September; the cheese exports are near a five-year low.

Chart III - Cheese Export by year for the Last Five Years
Chart IV reviews the cheese exports YTD by country.   Mexico remains the largest importer by far.  Imports of cheese to Mexico are virtually flat vs. the prior year.  A few other countries like South Korea have purchased more this year, but those increases are small and largely offset by losses in other countries.

Chart IV - Cheese Exports by Country

Cheese production (Charts V and VI) has raced well ahead of prior years.  The data in Chart V shows an increase well ahead of the prior year.  Chart VI shows that for the last three years production has been well above the long-term trend line.

Chart V - Cheese Production for the Last Five Years
Chart VI - Cheese Inventory for the last 18 Years
As a result, Inventory levels have risen well above those needed to support the domestic increase in cheese consumption.

Chart VII - Cheese Inventory by Year for the Last Five Years
With these analytical charts, it is clear that the problem of low producer milk prices centers around over production of cheese and lagging cheese exports.  The over production of cheese is somewhat caused by too much milk.  The lack of cheese exports is a little more difficult to explain.  Certainly, there is some impact from the Mexican cheese tariffs recently imposed.  However, the stagnant cheese exports are a problem of a much longer duration.


Sunday, November 11, 2018

The New Normal?

October Class and Component Prices were announced October 31.  Prices were mixed resulting in a 3.5% drop in the Class III price to $15.53/cwt.  That is a pretty normal price based on current history.  This post will review the "new normal" for milk and component pricing.  Prices have been fairly consistent for over three years.

Chart I - Dashboard of Dairy Prices
A quick review of Class III milk prices (Chart II) shows that for over three years the price has been in a fairly tight range from about $13/cwt. to $17/cwt.  Currently, at $15.53/cwt. the price is near the midpoint of the range.  Compared to Class III price movements in the past, this is a very long time for prices to be in such a tight range.  Considering inflationary adjustments, the price of Class III milk is at a low and is staying there for a longer time than ever before.

Chart II - Class III Milk Prices 2000 to 2018
The Class III milk price is primarily based on the price of cheese.  Therefore, Chart III which shows the cheese price over the same time period looks almost identical to Chart II.  For a review of the linkage between cheese pricing and the Class III price, see the April 16 post to this blog.   As long as the price of cheese is low, the price of Class III milk will remain low.

Class III - NASS Cheese Prices 2000 to 2018
Butter prices (Chart IV) has a similar tight range.  The range represents a new higher price level for butter.  The range is between $1.80/lb. and $2.70/lb., well above the long-term butter price.

Chart IV - NASS Butter Prices 2000 to 2018
And, Nonfat Dry Milk (NDM) prices (Chart V) have a clearly lower price also within a tight range for the last three years.  The price range is between $.70/lb. and $1.10/lb.  Cheese and Class III milk prices are low considering inflationary adjustments.  In the case of NDM, the price range is low even without an inflationary adjustment.  The demand for more butter and lower reduced fat fluid milk have lead to an abundance of NDM.  Too much supply equals lower prices,

Chart V - NDM Price 2000 to 2018
If we look at the comparative cheese and butter prices we also see a multiple year period of butter worth about $.70/lb. more than cheese.  That difference seems to be spreading.  In the past, butter has been worth more than cheese for only short periods of time.  This time, butter is worth more than cheese for over three years.

Chart VI - Cheese and Butter Price difference 2000 to 2018
Clearly we are in a period different from any other periods since this current pricing was started in 2000.   

Is this the new norm?  Will milk prices stay low?  Will butter remain expensive?  Will NDM remain low priced?

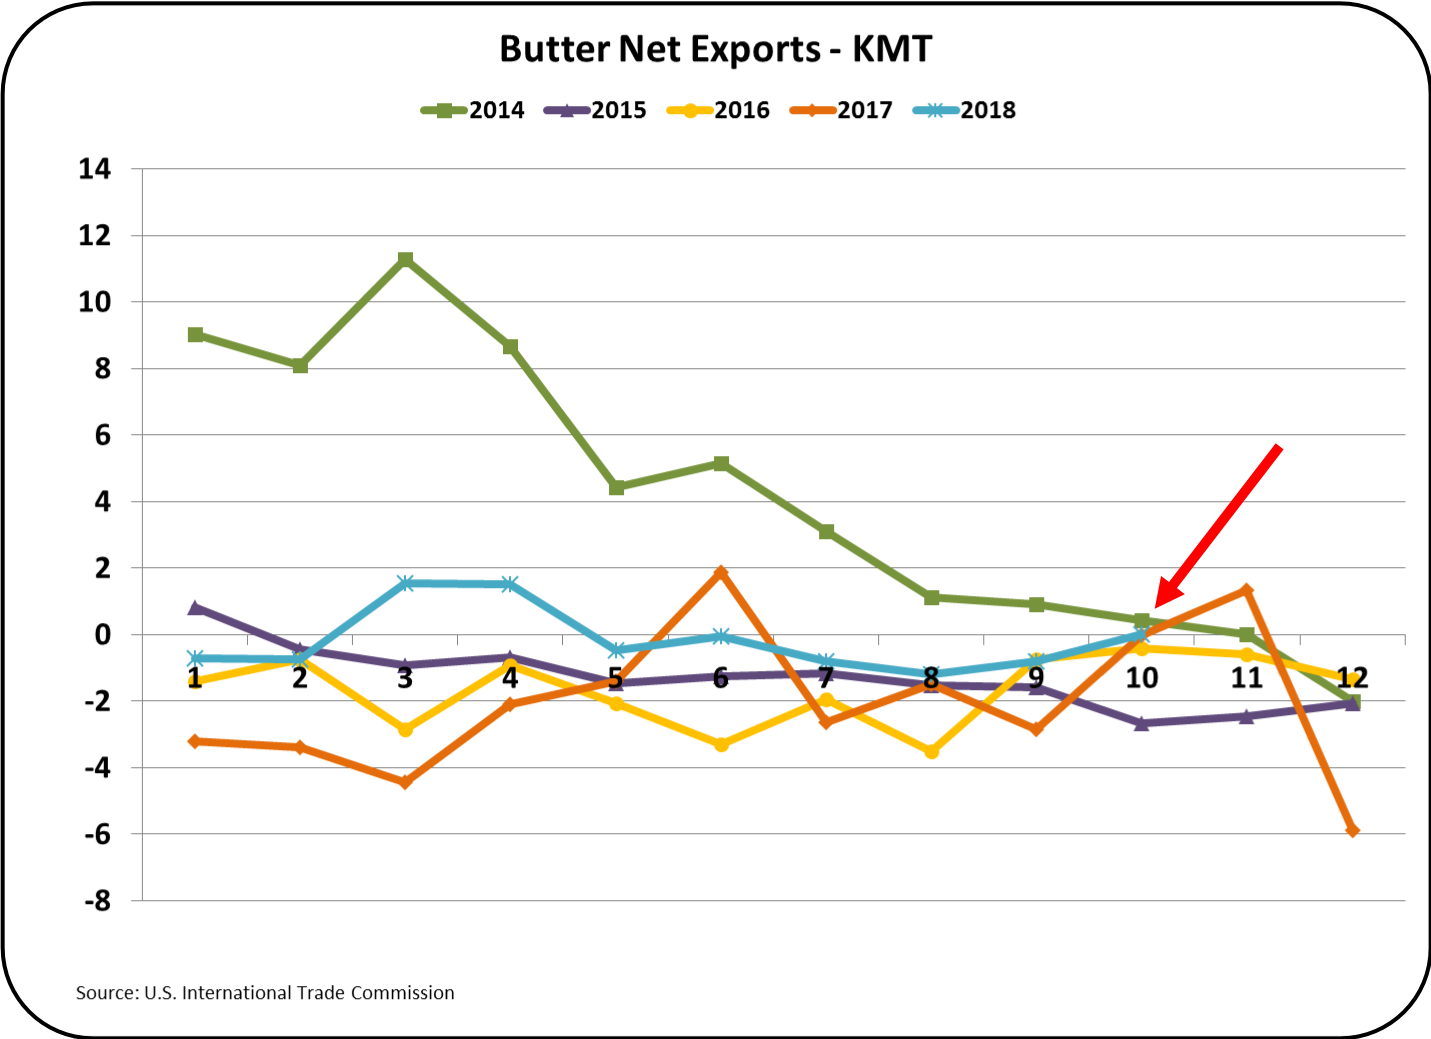
The reason behind the current circumstances is simply, too much milk, too much cheese in inventory, declining consumption of fluid milk, exports that don't seem able to export cheese, and increased consumption of butter, which leaves a lot of NDM to be disposed of at lower prices.  It is the perfect storm of financial issues for the U.S. dairy industry.  

What will probably not change?  Decreased consumption of fluid milk is a continuation of a very long trend that is accelerating.  It is very unlikely that the trend will change.  Because fluid milk (Class I milk) is the highest paid, that will cause some long-term reduction in the uniform or average producer milk price.

Will the volume of producer milk quit growing and perhaps shrink?  Low milk prices are forcing some producers out.  However, the long-term trend of more milk per cows continues and will continue.  The only thing that can reduce more milk is lower prices to limit herd expansions and force more producers out.  That's a pretty grim statement, but it is incontestable.

Will cheese consumption continue to grow?  U.S. cheese consumption has grown for over 100 years.  Per capita consumption is still less than other mature markets like France.  However, as the market matures, the rate of growth is slowing down.  That is what a mature market does.  The cheese market, Class III milk, is the largest segment and even moderate growth will help.  
  
Can exports begin selling high value dairy products like cheese?  This is certainly a wild card.  If the U.S. can develop strong international brands, there could be a stable growing market.  This would require more vertical integration of the dairy industry with a plan to develop brands that carry the language and graphics for the international market segment.  

Will butter consumption continue to grow?  Domestic consumption increases are beginning to slow.  Will consumer look to a more vegetable based diet?  This is certainly another wild card.

The recent market analysis done by the USDA sees steady growth is both the domestic market and the export market.  Frankly, it is not hard to find fault with the analysis.  International events are always adding volatility to exports.  The growth in the domestic market is hard to rationalize with declining fluid milk consumption and a slowing of cheese consumption.

The above analysis does not project a rosy environment for growth of the U.S. dairy market.  That said, there is opportunity to make money as a milk producer if a strong emphasis is made on component production and tight financial controls.


Sunday, November 4, 2018

Where is Class I Milk Crashing?

In the prior post, the decline in Class I milk was examined for the U.S. in total.  That post has raised questions as to where the impact is greatest.   This post will examine the decline in each of the ten Federal Milk Marking Orders (FMMOs).  In summary, all FMMOs are seeing a decline in the amount of Class I milk.  Some are seeing steady declines while other are seeing accelerating declines.  The charts below will examine the FMMOs with the fastest accelerating declines compared to those with a slower decline.   The amount of Class I milk in each FMMO is always based on the amount processed.  It may not be representative of consumption in that area.  Because Class I milk cannot be de-pooled, the numbers represent an accurate portrayal of the declines.  In all graphs the same mathematical trend-line has been applied.

The table below shows the January to September YTD decline for each of the FMMOs.  As can be seen, all FMMOs are showing declines in 2018.

Table I - Class I Decline by FMMO vs. Prior Year
The three with the largest declines are the Upper Midwest, the Northwest, and the Mideast FMMOs.  The declines in these three are significantly accelerating.   In terms of size, they represent 28% of the total Class I milk.
Chart I - Upper Midwest FMMO Class I Percent Decline vs. Prior Year
Chart II - Upper Midwest FMMO Class I Percent Decline vs. Prior Year
Chart III - Northwest FMMO Class I Percent Decline vs. Prior Year
At the other end of the scale is the Southeast FMMO.  While the Southeast has a steadily declining Class I volume, the decline is not significantly accelerating. That is a good as it gets.  Every other FMMO does have an accelerating decline in volume, but not as rapid decline as the Upper Midwest, the Mideast and the Northeast.

Chart IV - Southeast FMMO Class I Percent Decline vs. Prior Year
What does this mean financially to the producers in these FMMO?  The faster the decline, the faster the average (Uniform) price of milk in the FMMO will drop. What this means in the Upper Midwest is that the Class I impact of keeping the Producer Price Differential (PPD) positive will diminish.  The frequency of a negative PPD will increase.  Typically many of the producers will de-pool when the PPD goes negative.  Much of the milk in the Upper Midwest is already being de-pooled.  With the declining amount of higher priced Class I milk, de-pooling of Class II, III, and IV milk will expand.  Class I cannot be de-pooled.

The acceleration of the decline in drinking milk has been reviewed at least three times in this blog; May 28, 2018,  June 27, 2018, and October 26, 2018.  There is not doubt that the decline is accelerating.

Chart V below expresses the change in a slightly different way.  It shows that actual decline in millions of pounds for the Upper Midwest.  In January of 2014, 326 million pounds of milk were processed as Class I.  In the most recent month, September 2018, just 224 pounds were processed as Class I, a 1/3 reduction.

Chart V - Million Pounds of Class I Milk Processed in the Upper Midwest

There was a recent article published to show that the growth in Class III milk for cheese has more than offset the loss of fluid milk.  The author used data from 1975 through 2017 based on per capita consumption.  While his charts are correct, during this time population growth has slowed, the growth rate of cheese has declined from 6% in 1975 to 2% in 2017, and the decline in milk consumption has accelerated.   The current decline in Class I milk is a game changer for the U.S. dairy industry and will impact the entire industry.  The facts must be accepted so proper planning can be done.


Friday, October 26, 2018

Class I Milk Crash Accelerates


There are lots of headlines in the dairy news that milk production is continuing to grow.  There may be fewer cows, but the remaining cows are producing more milk.  This post will look at the other side of the supply/demand ratio, specifically, the decline in milk consumption.  In the May 26 post to this blog, the declining consumption of fluid milk was analyzed based on consumption data.  Not only was it declining, but the decline also appeared to be accelerating.  This post will update the fluid milk "disappearance" by analyzing Class I milk production in the Federal Milk Marketing Orders.

Fluid milk is perishable and requires refrigeration.  It cannot be frozen or economically stored for long periods of time.  Therefore, the link between production of fluid milk and consumption is firm and tightly linked.  What is produced must be sold within a very limited time.

Chart I below shows the monthly production of Class I milk.  For years per capita consumption has been declining, but population growth has keep the Class I milk category stable.  But, starting in 2017, the total Class I milk  category started a decline.  As we get more data on the decline, it becomes obvious that the decline is accelerating.  The trend line in Chart I was extended through 2019.  By the end of 2019, Class I milk will be down to about 3000 million pounds per year by this analysis.  Compared to 2016, that would represent a 13 percent drop.  Declines typically shrink in pounds as they reach a new plateau.  The decline in dairy milk is not following that pattern.  Its volume decline is increasing with time.

Chart I - Class I Milk per Month
Class I milk is always the highest paid milk.  The FMMO formulas are designed to assure this pricing structure.  The "Uniform" milk price is the weighted average of the four calculated milk classifications.  Producers are essentially paid by the  "Uniform" price through procedures such as the Producer Price Differential.  As less Class I milk is produced, the "Uniform" producer price will therefore decline.  Chart II below shows the reduction in the percentage of Class I milk in the total producer milk.  The trend line shows a decline from around 33% of Class I milk in the mix to a level around 28% by the end of 2019.

Unless something changes, the decline will continue and Class I milk will have a reduced impact on the "Uniform" price and, all other things equal", the "Uniform" price will decline.

Chart II - Class I Milk as a percent of Total Milk
Chart III is the most important change.  It shows the increasing rate of volume decline.  In 2016, Class I was not increasing or decreasing.  By year-end 2017, it was decreasing by more than one percent per year.  By year-end 2018, the volume of Class I milk will be decreasing by about three percent per year.  If the trends continue, by year-end 2019, the rate of decline will be about 6 percent per year.  These numbers are lower than those calculated by the using consumer consumption data in an earlier post.  However, both sets of data do show a rapidly increasing reduction in Class I milk.

Chart III - Class I Milk Reduction from Prior Year
The biggest problem is that there is weakening domestic demand for milk while the supply side keeps growing.  Can exports make up the difference?  Exports have shown growth in inexpensive products, but exports of high quality dairy products like cheese have not grown. Due to the water content in Class I milk and the limited shelf life, Class I milk is not a good export item.  The volume of Class I milk is strictly dependent on domestic consumption.  Export activity is not currently helping producer milk prices.

The decline in drinking milk appears to be the start of a long-term trend and the depth of the trend is growing.  It has to be faced directly and plans made to insure the financial future of the dairy industry with less Class I milk.

Sunday, October 14, 2018

Cheese Exports are "Stuck in the Mud"

August dairy export and import data are now available.   In order to increase producer milk prices, cheese inventories must be reduced.  Domestic cheese consumption grows every year at about 2% annually.  However, cheese production is geared to also provide cheese for export in increasing amounts.  That is not happening.  For a review of the importance of the cheese price on producer milk prices, see the later half of this post.

Chart I below shows cheese exports over the last 19 years.  From 2004 to 2014 cheese exports were on a very nice growth curve.  Then the bottom dropped out and cheese exports declined dramatically.  They recovered some in 2016, but have not grown since then.

Chart I - Cheese Exports Since 2000
Chart II shows cheese exports by year for the last five years.  There is no growth.  In fact the current year is lower than the prior year and lower than 2014.

Chart II - Cheese Exports by Year
Chart III compares cheese exports by country.  There is some minor growth in cheese exports to South Korea, Japan and a few other countries, but there is essentially no significant growth in cheese exports to any country.  Overall, cheese exports are not seeing any growth.

Chart III - Cheese Exports by Country
NDM/SMP has seen continuing export growth (Chart IV).  The growth is nothing new.  It has been steady for nearly 20 years.  With increased consumption of butter, more nonfat milk is available for drying and there always seem to be a market if the price is right.  As covered in the prior post,  the price of NDM/SMP has been in a slump for the last three years,

Chart IV - NDM/SMP exports Since 2000
Most of the NDM/SMP goes to Mexico (Chart V).  It does not require refrigeration and is very inexpensive.  Can more be absorbed in Mexico?

Chart V - NDM/SMP Exports by Country
Comparing cheese and NDM exports, there are some similarities but also major differences.
  • Mexico is the biggest buyer of both U.S. cheese and NDM/SMP.
  • Cheese is relatively expensive and cannot be afforded by many Mexican citizens.  It also requires refrigeration, which is not available in parts of Mexico.  The Mexican market may be saturated with expensive cheese.  
  • NDM/SMP is very inexpensive and does not require refrigeration.
Chart VI - Butter Exports by Country
Butter exports remain miniscule.  Domestic consumption demand for butter leaves little available for export.  What is exported does not have far to travel as most all butter exports go to Mexico or Canada.

Exchange rates are always a factor in international trade.  A weak currency improves a country's competitive position.  

The exchange rates for the two largest international dairy competitors, Europe and New Zealand, are both showing a strengthening of the USD.  In 2018, the USD has strengthened by more than 10% against the NZD, giving New Zealand a more competitive position in commodity sales.  The USD has also strengthened by slightly less than 10% against the Euro.

Chart VII - Exchange Rates for USD/Euro
Chart VIII - Exchange Rates for USD/NZD
When selling to our two biggest dairy customers, Mexico and Canada, the USD is also showing increased strength of about 5%.  This makes products sold to these countries 5% more expensive. 

Chart IX - Exchange Rates for USD/Mexican Peso 
Chart X - Exchange Rates for USD/CAD
There are lots of headlines about the impact of 25% tariffs, but in reality, exchange rates can have a bigger impact.  For instance, in 2008/09, when the USD strengthened by over 50% vs. the NZD, U.S. producer milk prices fell from $20/cwt. to $10/cwt.  Exchange rates don't make headlines, but they can be very impactful.