A ten year review of USD/Euro shifts shows the importance of this exchange rate. From 2008 through the start of 2017, the Euro has gotten consistently weaker vs. the USD. In mid 2008, the USD/Euro exchange rate was $1.55 per one Euro. In mid 2014 (an excellent time for milk prices, the exchange rate hovered near $1.40. At the beginning of 2017, that exchange rate fell to $1.08, a 30% drop from the highs of 2008. What does that mean? In 2008, a European exporter of cheese selling cheese for one Euro, competed evenly against U.S. cheese selling for $1.55. By the beginning of 2017, the U.S. exporter would have to price his cheese at $1.08 to compete evenly against the same EU cheese exporters in the international market. A strong USD always sounds good (stronger is better), but when it comes to exports, a stronger USD makes it more difficult to compete in the international markets.
 |
| Exchange Rate - USD/Euro |
Currently, the exchange rate is $1.12, not a huge improvement, but hopefully a trend to a weaker USD and a better market for U.S. dairy products.
The largest buyer of U.S. dairy products is Mexico. Unfortunately, from 2008 to early 2017, U.S. dairy products have become more expensive in Mexico due to the exchange rates. However, during 2017, the Mexican Peso has strengthened vs. the USD, making U.S. dairy products more affordable in Mexico. Dairy sales from the U.S. to Mexico continue to be robust. A stronger Mexican Peso should support additional purchases.
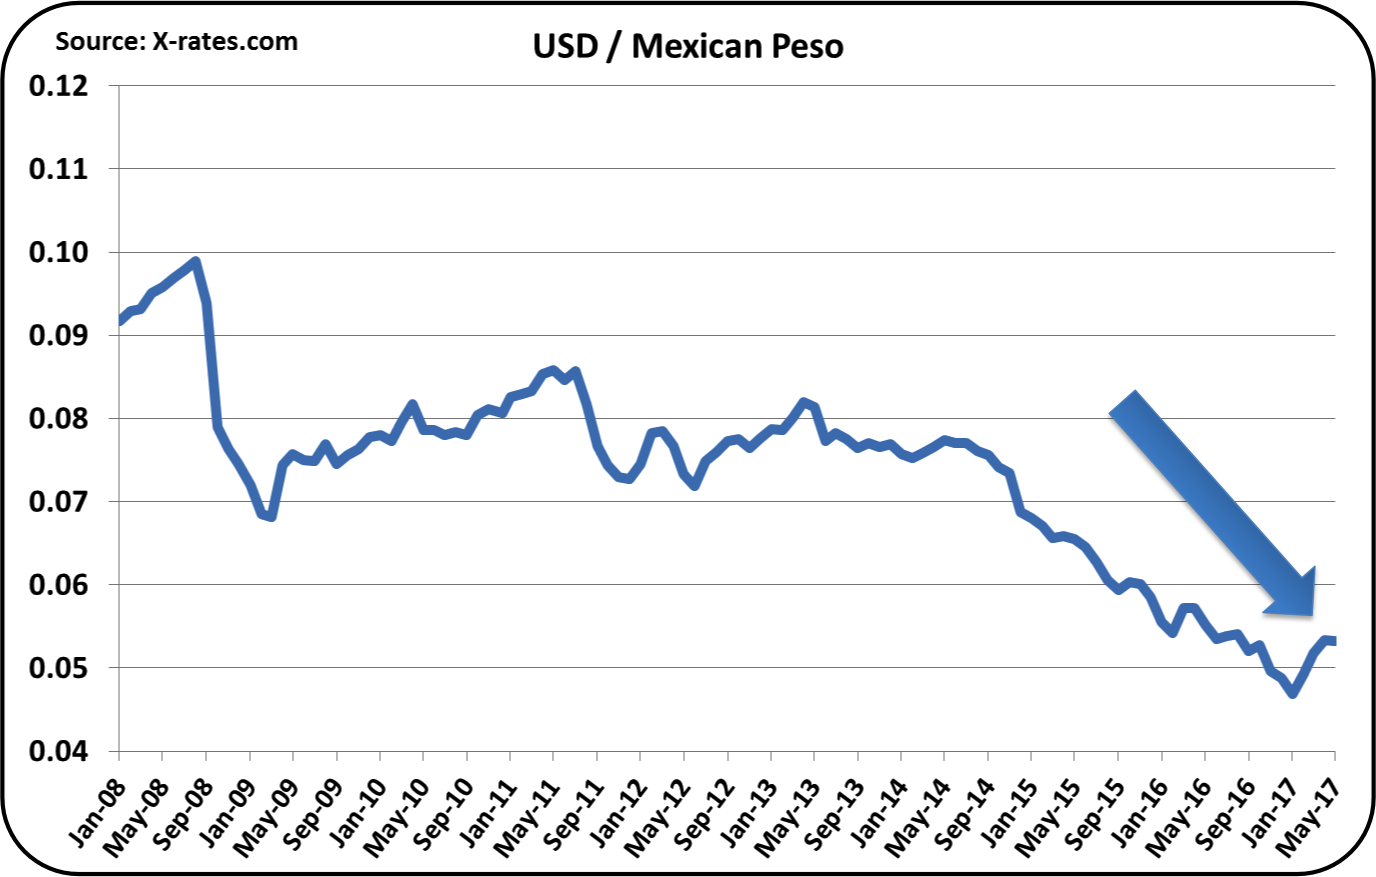 |
| Exchange Rates - USD/Mexican Peso |
However, not all exchange rates moved to the U.S. advantage. New Zealand is also a very strong international competitor. Roughly 80% of New Zealand's dairy production is exported. These exports are especially strong in the Pacific rim, but they are also strongly competitive worldwide. New Zealand dairy exports to the U.S. were up significantly in 2016. Unfortunately, the USD is continuing to strengthen against the NZD. As a result, New Zealand is again increasing milk production as exports expand. Dairy exports are very important to new Zealand's international trade balance.
A ten year review of USD/NZD exchange rates is shown below is a reminder of the importance of fluctuations in the USD/NZD. The chart shows historically the impact of exchange rates in 2008/2010. In 2008, the USD/NZD ratio showed a strong NZD. U.S. exports were strong and carried excellent prices. In 2009, the USD significantly strengthened vs. the NZD, making U.S. dairy exports uncompetitive with New Zealand dairy exports. (See the 2009 post to this blog.)
 |
| Exchange Rate - USD/NZD |
 |
| NASS Cheese Price - 2000 to 2017 |
Dairy exports to Canada are about half the size of the exports to Mexico, but Canada is still the second largest importer of U.S. dairy products. Unlike Mexico, the USD is continuing to strengthen vs. the Canadian dollar. The impact of this on U.S. exports to Canada have been overshadowed recently by the Canadian price controls on ultra-filtered dairy components which have reduced dairy exports to Canada. At this point, the adverse impact of a stronger USD vs. the CAD is having a minimal impact.
 |
| Exchange Rates - USD/CAD |
With the two most important exchange rates, the Euro and the Mexican Peso, moving in a positive direction, U.S. dairy exports should continue to make gains in the coming months. While the shift to a weaker USD vs. the NZD is troubling, the shift to date is minimal and should have a minimal impact on U.S. dairy exports.
Exchange rate data is always very current and immediately available. Export/import data has a one month plus lag in availability, so the impact of recent moves in exchange rates cannot be correlated time-wise with the export/import data that is reviewed below. International prices of U.S. dairy products are impacted by international supply and demand (too much available product means lower prices), and by exchange rates.
There are three factors that can influence U.S. dairy prices, domestic supply and demand, international supply and demand, and exchange rates. Of these three, exchange rates are the most volatile.
Overall, U.S. dairy exports are continuing to improve. They are still well below the volumes and prices of 2014, but progress is still progress. Cheese exports so far in 2017 are running well above 2016 levels.
 |
| U.S. Cheese Exports |
YTD, cheese imports are running below 2016 levels and close to 2015 levels. Lower imports mean more U.S. cheese is being used domestically.
 |
| U.S. Cheese Imports |
In total, cheese net exports (export - imports) are well above 2016 levels. While April numbers show a drop, this is most likely a short-term fluctuation, not a change in trends.
 |
| U.S Cheese Net Exports |
Mexico is by far the largest importer of U.S. cheese, but the increases are coming from South Korea and Australia.
 |
| Cheese Exports by Country |
The reduction in imports has mostly occurred from reductions of cheese imports from Italy and New Zealand.
 |
| Cheese Imports by Country |
Butter exports remain near zero and imports are down, bringing net exports to a near "0" balance. As reviewed in the prior post, the consumer demand for butter is outstripping production, so imports will likely increase.
 |
| Butter Net Exports |
Exports of NDM continue at near record levels. NDM is the largest U.S. export product. Domestic prices are determined by international prices, which have improved, but are still well below 2014 prices.
 |
| NDM Exports |
This post has been mostly about exchange rates. As the world continues to recover from the recession levels of 2008, the U.S. is a clear economic leader. This has caused the USD to strengthen against other currencies. Now the challenge is how to continue as a world economic leader, while reducing the strength of the USD.