July dairy exports were disappointing. Exports of every commodity used to price producer milk were down. On the positive side, exchanges rates improved vis-a-vis most all U.S. dairy-trading partners and competitors. That should improve future dairy exports. As shown in Chart I, butter exports were down by 32.5%. However, any movement in butter exports is usually a large percentage as there are almost no exports and therefore changes are large percentages. U.S. domestic demand for butter is exceeding dairy production, so there is very little butter to export. Most importantly, cheese exports were down again in July, disrupting the positive gains shown in prior months.
 |
| Chart I - Summary of Dairy Exports |
Shown below are the export charts of the four commodities used to calculate producer milk prices. It is easy to notice that the July data is down from the prior months in every chart.
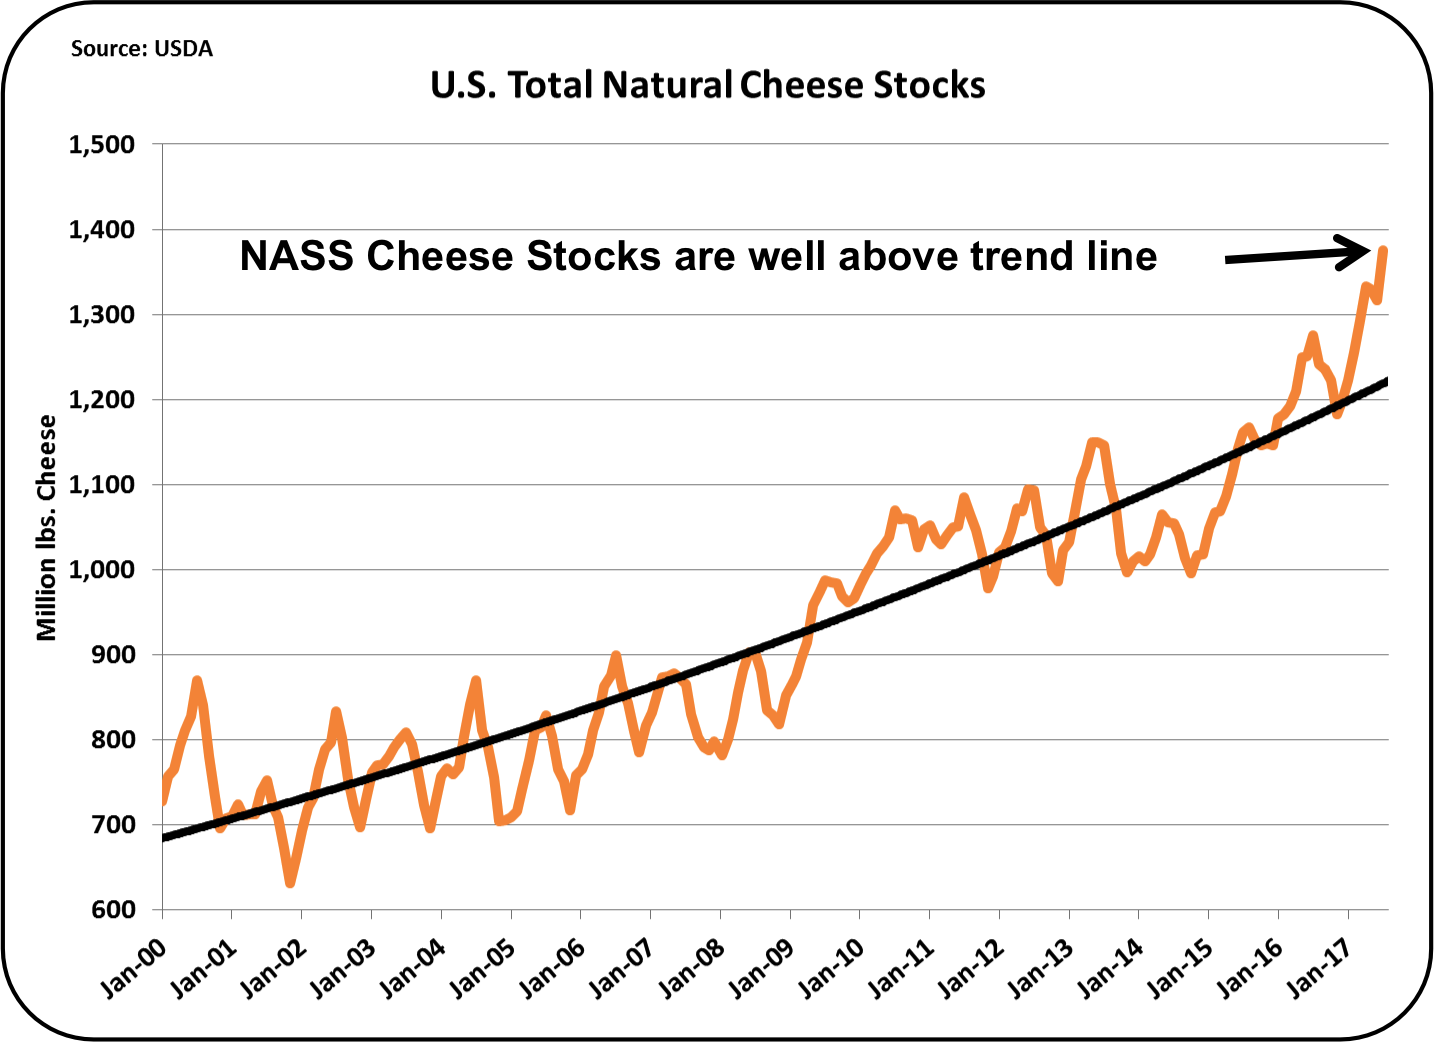
Cheese inventories are high as discussed in the
prior post. In May, it appeared that cheese exports were starting to reach record levels (see the
July 9 post to this blog). When June data was down, there were hopes that this was only a "blip" on an increasing trend. With the July data in, there are concerns that the "blip" really occurred in May with a near record level of monthly exports. With the very high levels of cheese inventories, there is not enough domestic demand to significantly shrink this inventory. Without an improvement in cheese exports, high inventories and low cheese prices will continue. The price of producer milk is tightly linked to the price of cheese (see
post on the mathematics of this correlation).
Chart II - Exports of Cheese
Butter exports were down slightly as shown in Chart III. Year-to-date, the only significant butter exported went to Canada, and that was small. Canada is in a unique position of having a butter shortage and an excess of milk protein. The high butter price in Canada does provide tempting opportunities for butter exports.
The strong demand for butter globally, in spite of the high prices, is creating a complicated supply and demand scenario ( see the
August 28 post for details).
 |
| Chart III - Exports of Butter |
The price of dry whey is the basis of "other solids" pricing. As mentioned in the prior post, dry whey is currently at an OK price. As a result, other solids pricing is not at a high, but it is making a nice contribution to the Class III price. It would be nice of the price of dry whey were higher, but it pales in significance to the influence of the cheese price.
 |
| Chart IV - Exports of Dry Whey |
Nonfat Dry Milk (NDM) pricing is the basis for pricing Class IV skim milk. The price of Class IV milk is important when the price is above the price of Class III milk. It then becomes the basis of Class I, Class II, and Class IV milk prices. However, the low price for NDM is keeping the Class IV price well below the Class III price for now.
 |
| Chart V - Exports of Nonfat Dry Milk |
The big positive for the month is exchange rates. The USD continues to weaken against most all currencies of dairy trading countries. Chart VI shows the improvement in the exchange rate between the USD and the Euro. Only a few months ago, the exchange rate was around $1.08 per Euro. It is now at $1.19 per Euro. That makes U.S. produced dairy products less expensive vs. the largest global dairy exporter, Europe.
 |
| Chart VI - USD/Euro Exchange Rate |
There has also been a very positive change in the other largest international dairy competitor, New Zealand. The USD/NZD exchange rate is currently down slightly, but there is a strong trend to a stronger NZD.
 |
| Chart V - USD/NZD Exchange Rate |
There is also a favorable change in the strength of the USD vs. the currencies of the largest customers of U.S. dairy products. Most importantly is the USD/Mexican Peso exchange rate. Since the beginning of 2017, the Mexican Peso has strengthened vs. the USD, making U.S. dairy products more affordable in Mexico.
 |
| Chart VI - USD. Mexican Peso Exchange Rate |
Canada is also a very important U.S. customer for dairy products. The strengthening of the CAD is similar to the strengthening of the Mexican Peso.
 |
| Chart VII - USD/CAD Exchange Rate |
In summary, while the July export data was a disappointment, the exchange rate data helps set the stage of improved exports. The most critical of these is exports of cheese.