Dairy imports and exports are very volatile and had a major impact on milk price volatility in 2008/09. Consumer demand is relatively predictable. Imports and export, although much smaller than domestic consumption, have a significant impact because they are so volatile.
What makes imports and export volatile? There are many things going on in the world that can influence the international market. A list would include; changes is global economies, emerging market developments, exchange rates, weather influences in dairy producing areas of the world, and international import and export controls imposed by countries. None of these factors are anything a dairy producer has any control over. Nevertheless, they can have a huge impact on imports and exports which have a significant impact on U.S. milk prices.
The U.S. Dairy Export Council does a great job of assisting dairy processors in finding export opportunities. By the numbers, 2011 was a terrific year. Dairy exports for 2011 were up 30% reaching a new high of $4.8 billion. Mexico remains our strongest export market with $1.1 billion or 23% of our total dairy exports. Exports to Mexico were up 41% in 2011. In 2011 we had a 70% increase in dairy exports to South Korea. South Korea is now our second biggest export market. Shown below is a pie chart of our most important dairy export influencing Class III milk pricing, cheese. South Korean is a close second to our long time largest dairy export country, Mexico.
Over the last 10 years, the U.S. has shown a steady increase in cheese exports and is now the third largest exporter in the world, behind the combined countries of the EU and New Zealand. U.S. Cheese exports have quadrupled over a ten year period.
The above numbers sound encouraging, but there were some year ending numbers that were not so encouraging. During 2011, we exported 224 thousand metric tons of cheese, up 29% over the previous year. But in December, 2011, U.S. cheese exports were up only 2% over the prior year. The data is shown graphically below:
The chart above displays the very nice 5 year trend in increasing cheese exports. However, as we look at the chart below, we see that some of the great gains made in 2010, are slipping a little in 2011.
The same analysis can be made for butter. Nearly 63 million metric tons were exported in 2011, up 12% from the prior year, but in December, 2011, exports were down 27% from the prior year.
The nice gains made in 2010 could not be repeated in 2011.
A more general comparison can be made with the USD Index. This index measures the strength of the USD against the six other currencies in the world that also freely fluctuate. While this index is displayed with the inverse relationship to the Euro chart above, it is easy to identify the dominance of the Euro on this Index.
In 2008, when dairy exports skyrocketed and then plunged, changes in the New Zealand Dollar (NZD)were a big factor. Currently, the USD has remained weak compared to the NZD. The New Zealand dairy industry is very dependent on exports and therefore changes in the NZD/USD ratio can have significant influence on U.S. Dairy exports. Currently, New Zealand does not have an exchange rate advantage like they did in 2009.
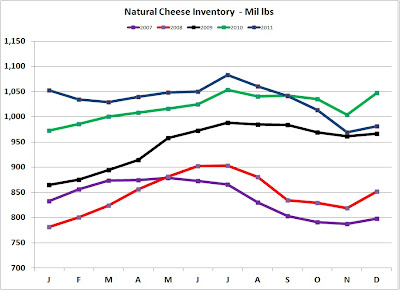
In the last post to this blog, cheese and butter inventories were reviewed. They both rose in December, 2011. Although new data is not available, this appears to be continuing as butter and cheese prices on the CME have fallen significantly. Apparently cheese production cannot change as rapidly as global market demand does. Cheese production in the U.S. reached new record highs in October, November, and December of 2011.
Like it or not, the dairy business is now a global business. The U.S. must learn to live with volatility and must learn to be the low cost producer. In a future post to this blog, tools to hedge against price swings will be discussed. Tools like contracts, futures, and options are tools for risk management.


