Sunday, December 13, 2009

How is 2009 Ending?

The year of 2009 is closing out in a "hold" position. Because U.S. milk prices are primarily determined by cheese prices, most of the comments below relate to factors that influence cheese prices.


The U.S. dollar's value leveled off versus other currencies in the last few months. A weaker dollar improves cheese exports and reduces cheese imports.


The New Zealand Dollar that was strengthening in the first three quarters of 2009 has leveled off and even weakened a little in the last two months. A weaker New Zealand Dollar makes New Zealand cheese cheaper on the global markets.


As a result, cheese imports have leveled off. They are below the highs at the beginning of 2009, but are only slightly above the 2008 levels.


Cheese exports have also leveled off. They are not near the highs reached in 2008, but they have moved off the lows from early 2009.


In the November 19 post the correlation between cheese prices and U.S. per capita consumption was established. In late 2008, after many months of $20/cwt milk prices, cheese prices established new highs, reducing consumer consumption. Those cheese prices have now fallen to the historical trend prices and consumption can be expected to increase.


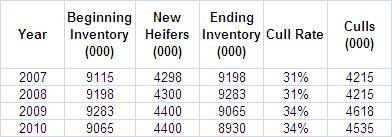
The USDA outlook for milk cows continues to forecast a very significant decrease in inventory. By the third quarter of 2010, the inventory is expected to drop to 8,950,000 cows.


A new report on cheese inventories is expected next week. Cheese inventories have been very high and must be reduced before a real recovery in cheese prices can be sustained.


Chicago Mercantile Exchange cheese prices have plateaued at levels much higher than in early 2009.

Statistics for the dairy industry have improved significantly from the first part of 2009, but appear to have leveled out well below the 2008 highs.

In early 2010, I will post the significant data for 2009 in final form. There will be no posts during the upcoming holidays. Have a safe and happy holiday. New posts will be available for your viewing in early 2010.

Friday, December 4, 2009

November Component Prices Improve

November Class and Component prices were announced today. As expected, they showed continued upward movement in all components and milk prices. Protein moved from $2.56/lb to $2.70/lb on the strength of the NASS Cheese price of $1.52/lb. Butterfat moved from $1.28/lb to $1.47/lb.


Class III milk prices increased from $12.82/cwt to $14.08/cwt in line with the increase in components.


CME block cheese prices have continued to advance and with the key NASS survey lagging about 2 weeks behind the CME prices, December should show continued improvement.

Tuesday, November 24, 2009

Too Many Heifers - Too Many Lactating Cows - Too Much Cheese

The number of lactating cows is decreasing quickly to bring balance between supply and demand. The number of cows peaked in the second quarter of 2009 and has started a nose dive that will continue through most of 2010.


In the last three years, the availability of replacement heifers has increased nearly 6%, probably the result of sexed semen.


More available heifers is a blessing when herds are increasing in size, but when herds are decreasing, the old "ladies" have to go to make room for the young "ladies". The combined impact of the decrease in the number of lactating dairy cows and the increase in replacement heifers will have a sizable impact on the overall national cull rate.


This cull rate (both voluntary and involuntary) represents over half of the cows that are in their second and later lactating cycle. With this high cull rate, the quality of the remaining cows should improve which will probably increase milk per cow. It also means that low producing cows will probably last through only one lactation period.

Many of the parameters for improved dairy profitability are on positive trends. However, before real and lasting recovery can be achieved, three excesses must be corrected.

  • Too many heifers

  • Too many lactating cows

  • Too much cheese in inventory
  • Thursday, November 19, 2009

    What Makes Demand Vary More? Cheese Consumption or Exports/Imports

    In the November 15 post, the variation in per capita consumption of cheese was discussed. The variation from the long term trend in cheese consumption was caused by higher milk prices and was the largest variation in nearly 40 years.


    From peak to low, the variation was 2.7% from the trend line.

    In this post, we'll compare that variation in demand with the fluctuations in demand caused by variations in imports and exports. There are only two factors that make up the demand for U.S. cheese, U.S. consumption and imports/exports.

    Imports have seen a 3.25% variation in the last 2 1/2 years. This percentage is based on the same scale as the per capita cheese consumption; percent of consumption. Therefore, the 3.25% variation is exactly comparible to the 2.7% shown above for variation in consumption.


    When we look at exports, also measuring variation as a percent of consumption, we see another 2% variation.


    The combined impact of variations in imports and export is over 5%, nearly double the variation in U.S. consumer demand.

    The conclusion we can draw from this is that the biggest impact on the demand for U.S. cheese comes from the U.S. ability to compete for cheese sales on the global markets with the purpose of increasing exports and decreasing imports. The ability to compete successfully for global cheese sales is the key to demand and increased demand has a positive price impact on U.S. produced cheese. Effort needs to be focused in this area for long term success.

    In the next post we'll look the the milk supply side. How many cows will there be in 2010 and how much milk will be produced?

    Sunday, November 15, 2009

    What Influences Cheese Consumption?

    What makes U.S. per capita cheese consumption change? In the July 26 post to this blog, we examined the link between recessions and changes in cheese consumption. Upon review of the history of recessions and cheese consumption, there is no indication that people eat less cheese in a recession than at other times.

    However, in 2008 and early 2009, cheese consumption did decrease significantly. This post examines the link between cheese consumption and cheese prices. Is there price elasticity? As cheese prices increase, does demand slacken? As cheese prices decrease, does demand increase? The graphs below indicate that there is in fact price elasticity of demand. When the prices move up significantly, the growth in per capita cheese consumption goes down.

    The biggest increase in cheese prices in the last 30 years occurred in 2008. Cheese consumption actually decreased from 2007. This same pattern has occurred other times over the last 30 years.


    This clearly shows that when milk prices increase to historic highs, retail cheese prices will follow and consumption will take a hit.

    Many things caused the 2008/09 dairy economic disaster.

    • A strengthening of the USD caused U.S. cheese to be expensive on the global market and exports decreased.
    • A weak New Zealand dollar made New Zealand cheese "cheap" on the global market and U.S. imports increased.
    • U.S. retailers increased cheese prices dampening consumer demand for cheese.
    • The U.S. Dairy industry increased the number of cows significantly and brought milk production to all time highs. This was at a time when demand for U.S. cheese was decreasing.

    The chart below shows the consumer price index for cheese from 1980 through September, 2009. The 2008/09 bubble can be clearly seen. As of mid 2009, cheese prices are back to their historical pricing levels.


    Examining the last three years more closely (the area in the box on the above graph) we can clearly see the bubble and the current pricing. The current pricing should bring cheese consumption back to normal growth levels if historic relationships prevail.


    There are two important lessons to learn from this.
    1. Very high milk prices will lead to very high cheese prices and demand will fall.
    2. Cheese consumers are sensitive to cheese prices and will reduce consumption with a significant increase in prices.

    The U.S. dairy market is on it's way to recovery. In previous posts we have established that the Dairy business is global and influenced by global factors. In a global market, the low cost producer will win. Low cost milk protein is the key to low cost cheese.

    Which cheese demand factors are the most important? The import/export markets or U.S. consumption? The comparison will be made in an upcoming post to this blog.

    Friday, October 30, 2009

    October Prices Announced

    October Class III milk and component prices were announced today. All prices are up significantly and showing positive trends of recovery from the last 11 months of extremely low prices. Protein, the most significant factor in the milk check recovered to $2.5584/lb., well under the $4.71 high of December 2007, but 50% above the low of $1.70 in July 2009.

    Butterfat prices remained fairly constant at $1.27/lb.


    As a result of these higher component prices, the Class III price advanced to $12.82/cwt, well below the December 2007 high of $20.60, but 38% above the February 2009 low of $9.31.


    The National Agricultural Statistical Service (NASS) Survey of Cheese prices that is used to establish protein prices also showed nice improvement and a nice trend reaching $1.4110/lb. for the month of October.


    The NASS cheese prices run about two weeks behind the Chicago Mercantile Exchange (CME) cheese prices which have advanced to levels near $1.50/lb. Because the NASS prices are based on a broad survey and the CME prices are based on only a few minutes of trades each day, the NASS prices generally follow the CME pricing but with a little less volatility. Hoard's Dairy provides a very nice graph which follows both prices. Based on the CME pricing, we can expect some lift in the NASS prices in the next few weeks which will influence the November prices.


    Everything seems to be lining up for a nice recovery in dairy prices. However, before the final recovery can take place, the cheese inventories that have reached record highs will have to be reduced. This will delay a full recovery, but at least there is light at the end of the tunnel.

    Monday, October 19, 2009

    How Many Cows will the U.S. Reduce?

    The first chart below compares Class III milk prices with the number of lactating cows in the U.S. It appears to be an inverse relationship - when the prices go down, the number of cows goes up! Obviously, this is not the case.


    In the next chart, the number of cows is compared to the Class III milk prices when the prices are moved 12 months forward. In other words, when the milk prices change, how does that compare to the number of cows one year later?


    A correlation now begins to show. The data indicates that the milk prices are an indicator of the number of lactating cows one year later. This makes sense, in that, as prices rise, producers begin considering expansion. By the time they execute their plans and get fresh heifers ready to milk, a year has passed. When prices drop, no one knows how long it will last or how deep the prices will fall, so there is a delay in reducing herd size. When there is a long and deep period of low milk prices, the ability to stay in the dairy business comes into play and some producers may not be able to finance refreshing their herds with new heifers.

    This 12 month difference between milk prices and herd size was tested vs. other lead times ranging from 10 months to 14 months. Statistically, the closest relationship between milk prices and the number of cows occurs at 12 months. With this in mind, below is a graph which could be used to predict the future cow inventory in the U.S. If the falling milk prices experienced in the last 12 months are used as an indicator of herd size in the next 12 months, we can expect very sizable herd reductions lasting well into 2010.

    Supporting this prediction, the current USDA forecast indicates a very drastic reduction in cow numbers lasting through the second quarter of 2010. While cow numbers are currently down approximately 165,000 head from their 2008 highs, the current USDA forecast will bring the number of lactating cows down nearly 400,000 from those 2008 peaks.


    We are now exiting the period of too many cows and exchange rates that were unfavorable to cheese exports. It would appear that we are now entering a period of too few cows and very favorable exchange rates for exports. This is occurring at a time when grain and oilseed prices are also moderating.

    The history of the dairy business is one of boom and bust cycles. It looks like we're heading into a boom period that may match or exceed the extremes of the bust we're exiting.

    Monday, October 12, 2009

    Why has the Make Allowance Changed so Much?

    Many factors point to a recovering dairy market, however, full recovery is still in the future. Through 2007 and the early part of 2008 milk prices were very high. During that time, the cheese makers were able to get significant increases in the make allowance in the Federal Milk Marketing Order milk pricing formulas.

    In the April 7 post to this blog, the formulas were reduced to the simplest form to illustrate the importance of cheese prices in the formulas. To arrive at the standard Class III milk price, one can multiply the cheese prices times 9.6, the dry whey price by 5.9 and the butter price times just .4.

    Then one needs to subtract the make allowances (the cost to convert the milk to cheese, whey, and butter). For the current formulas that is $3.17/cwt of milk.

    Class III Milk Price = + 9.6 x Cheese Price + 5.9 x Dry Whey Price + 0.4 x Butter Price - $3.17

    Over the course of 2007 and 2008, the make allowances were increased by a significant 23%. This amounts to $.60/cwt re-allocated from the dairy producer to the cheese producers.


    If the pricing formula changes were evaluated at September 2009 Class III component prices, it would make a significant change in what the dairyman receives.

    (Due to rounding, the actual Class III price differs slightly from the simplified calculation.)


    1. The increases in make allowances were made during a period when milk prices were high - see the chart below. The red arrows mark the dates when the make allowance changes were effective. There was no decrease in the make allowance when milk prices deteriorated. The reallocation of funds from the milk producer to the cheese producer stayed in place in spite of high losses to producers. The $.60 change is obviously a much bigger percentage to the milk producer when milk prices are low.


    2. Cheese manufacturing has reached significant economies of scale, and new cheese plants are being built with a high degree of automation and the capability to very precisely blend ingredients. While automation is expensive, it is never used unless there is a significant return on investment through cost reduction for the expenditure. The cost to make cheese should be going down, not up.

    If the U.S. is to remain a major supplier to the global cheese markets, all factors in the chain must be extremely efficient. If there is no pressure to improve, there will be no improvements. A reasonable and comfortable make allowance does not create pressure to improve.

    Sunday, October 4, 2009

    September Prices Announced

    September Class III milk and component prices were announced on October 2. The increase was primarily the result of the increase in support prices announced by Secretary Vilsack on July 31.

    The Class III price for September was $12.11/cwt compared to $11.20 for August and $9.97 for July. While this is a welcome improvement, it is still far from the 2007/8 highs.


    The increases are primarily the result of the higher support prices for cheese and nonfat dry milk. Unfortunately, these price supports are scheduled to expire at the end of October, and with the historically high inventories of cheese, there is little reason to believe that prices will not retreat to their former levels.

    The chart below shows the transition of prices since January 1, 2000. Of particular interest is the butterfat price which has not been influenced by price supports and remains around the historical levels of $1.20/lb.


    The protein price is primarily dependent on cheese prices. The U.S. and global supply of cheese has kept prices extremely low.


    Although there are strong indicators of coming relief for the dairy industry (see September 21 post to this blog), these indicators must continue their trends in exchange rates (weaker USD) and reduced cow numbers before real recovery is reached . There is light at the end of the tunnel, but it is still dim.

    Thursday, October 1, 2009

    Dairy Production in India, China, & Russia does not Influence U.S. Prices

    There are a few major milk producing countries that have not been analyzed in this blog, and there are good reasons why. As the graphs below are reviewed, the reasons will become obvious.


    There are three major milk producers we have not discussed. The largest, by far, is India. China and Russia are also significant producers.


    Fluid milk is not a good product for international trading. Milk is 88% water and has a relatively short shelf life. In the following charts, cheese and milk powder production are analyzed.


    Cheese is the international currency of the global dairy industry. India has almost no cheese production at all and, for that reason, India has not been discussed as a player in the global dairy markets. While Brazil, Russia, China, and Canada have decent sized cheese production, it is consumed within their countries and they are not major exporters.

    The picture changes when skim and whole milk powder are examined.


    Skim milk powder has a long shelf life without refrigeration. It is often used in cheese manufacturing to boost protein. However, Skim milk powder has a very low value, typically just above the $.80/lb support prices. That limits the range for international shipments as shipping costs can easily outweigh other higher prices.

    Now for the big surprise - Whole Milk Powder. China dominates this market. The U.S. is not really a player in this market. Fluid milk made from whole milk powder does not compare to real milk. The ready availablity of fluid milk in the U.S. leaves no significant market for whole milk powder. Because of the butterfat in whole milk powder, it must be refrigerated and does not have a long shelf life. Whole milk powder is used in cooking, but this is a very small market.


    The focus in this blog is always cheese. The pricing formulas are all based heavily on cheese prices and Chicago Mercantile Exchange prices are based on supply and demand in the U.S. As has been demonstrated in some of the past posts, demand does not significantly fluctuate. However, imports and exports of cheese have a tremendous impact on cheese prices and those statistics are often driven by exchange rates.

    This data was compiled from the 2009 Agricultural Statistical database compliled by the Organization for Economic Co-operation and Development (OECD) and the United Nation’s Food and Agricultural Organization (FAO).

    In the next post, we'll get back to the basics for U.S. pricing. This post was only to review the global milk production and explain why the focus is not on some of the large milk producing countries.

    Monday, September 21, 2009

    Status of Key Statistics

    In this post, the current macro economic data that influences the dairy industry will be reviewed. In many previous posts, the changing nature of the U.S. Dairy Industry has been analyzed. The U.S. dairy industry's economic health is dependent on cheese prices. Cheese prices are dependent on the global markets for cheese and the relative position of U.S. cheese in that market.

    First, let's look at a few charts on exchange rates. The USD as compared to six other currencies is shown below. A weaker USD has the impact of making U.S. cheese "cheaper" on the global market increasing exports and reducing imports.


    Clearly, the USD is weakening against the other currencies. It has not reached the late 2008 levels, but it is headed downward.

    One important currency we have followed is the New Zealand Dollar vs. the USD. A stronger New Zealand Dollar increases the price of New Zealand Cheese on the global market.

    The New Zealand Dollar has seen significant strengthening against the USD. It also has not reached the 2008 levels that helped U.S. dairy prices, but it is headed upward.

    Next we'll look at cheese exports and imports from the U.S.

    Cheese exports have also started to edge upward, although they are a long way from the 2008 levels.


    Cheese imports have settled down from their Q4 2008 spikes and may be headed lower if the trends continue.

    The USDA released their latest outlook report on September 19.


    It shows an expected continuation of the decrease in dairy cow numbers to 8,955,000 by the end of Q2, 2010. This represents a decrease of 375,000 cows from the two years prior.


    By Q2 2010, Class III milk prices are forecast to be between $13.75 and $14.75 per cwt. This is a nice increase from the lows of 2009, but still a long way from the 2008 highs.


    Similarly, cheese prices are expected to recover during 2010 as well hitting between $1.51 and $1.61 per pound.

    Feed costs have dropped significantly as corn prices have dropped to the low $3 per bushel.

    Not bad trends, but even modest recovery is still about a year away. Also slowing the recovery will be the huge cheese inventories that have been built during the low milk price periods.

    Monday, September 14, 2009

    The Global Cheese Market

    This post will examine the global cheese markets by country. As a reminder, the U.S. dairy industry milk prices are primarily based on Cheese (April 7 post). Cheese markets are global and influenced by global supply and demand (April 13 post).

    Like any market analysis, global consumption by country, imports by country, and export by country will be examined.

    If the U.S. is to be a major supplier, a marketing plan must be developed based on where the demand is, what countries have supplies in excess of consumption (exporters), and which countries have supplies that do not meet consumption (importers).

    Per capita consumption of cheese varies significantly by country. Using per capita consumption removes the impact of the size of the country to see where the people are that consume cheese. Generally speaking, per capita consumption rises with wealth and acceptance of dairy products in the country culture.

    Clearly, the populations of Europe and the U.S. are the major cheese consumers. Some other countries also have well developed cheese consumption patterns. In the Americas, Argentina, Canada, Chili, and Mexico have significant cheese consumption in their diets. In China and India, a significant taste for cheese has not developed.


    Who are the big importers that do not have a dairy and cheese business large enough to supply demand or have tastes for imported cheese, or where pricing makes imports more attractive than local production? Below, 2008 cheese import data is shown by country. Russia is a major cheese importer. In the Americas, the U.S. and Mexico are significant importers.


    Finally, what countries have developed cheese production that allows them to export significant quantities? The "players" here are Europe, New Zealand, Australia, and the U.S. in that order.

    In a traditional sense, if the U.S. dairy industry wants to be a major participant in global cheese markets, the near term targets would be countries that have a taste for cheese (consumption). The near term opportunities would be the countries that need cheese imports to meet their demand, and the competition would be the countries that have the capacity to export significant quantities.

    This analysis was done to help create a vision of where the U.S. dairy industry needs to position itself for growth in the near term. Policies and strategies need to be developed to properly position U.S. cheese in the international markets.

    What group is coordinating this effort?

    Friday, September 4, 2009

    August Class III Price Announcements

    On September 4, the August Class III milk and component prices were announced. For details, the full report on pricing is available in the September 4 Dairy Product Prices release. The only surprises were the minial impact of the new support levels for cheese announced by Secretary Vilsack on July 31.


    Protein increased to $2.10/lb. and fat stayed at its current level $1.25. While the increase in protein from $1.79 to $2.10/lb is welcomed, it is still a long way from the 2007/8 levels.


    The increase in support levels, which were effective August 1, are scheduled to last only through October. Due to the lag in NASS reporting of cheese prices, the new support levels were only effective for three of the five weeks in this reporting period.


    Perhaps the important fact for producers is to remain cognizant of the factors that influence the top line. At the standard USDA levels of 3.1% protein and 3.5% butterfat, the protein at this month's prices is worth $6.51/cwt of milk while butterfat is worth $4.37/cwt. The big money remains in protein, and maximizing protein is still the best way to maximize income. Maximizing butterfat is the next most important factor in maximizing income.

    Sunday, August 30, 2009

    Where did the Current Dairy Problem Come From?

    In some of the previous posts to this blog, we have established that cheese pricing, as influenced by supply and demand, has led to the current economic woes of the U.S. Dairy Industry. More milk goes to cheese than any other category and the Federal Milk Marketing Order payment system is based primarily on cheese prices. How did we get too much cheese, who did it, and when will it be corrected?

    In this post, we will examine what led to the current dilemma and what it will take to return to high milk component pricing.

    In the July 26 post, we showed how the growth of cheese consumption in the U.S. has been extremely steady. In this post, the other side of the supply/demand equation will be studied. In other words, cheese production will be studied independent of cheese consumption.


    A number of countries have been reporting accurate cheese production numbers for nearly 40 years. This includes the following list of countries:


    • Argentina

    • Australia

    • Brazil

    • Canada

    • New Mexico

    • New Zealand

    • USA

    With the exception of the European Union (EU), the list includes all the major cheese producing countries.


    The chart below shows the growth in cheese production year by year for all these countries combined. Starting in 2006, world cheese production started to exceed the normal growth illustrated by the straight line on this chart. By 2008, cheese production was above the straight line growth by a greater amount than ever seen in this nearly 40 year history. There was just too much cheese in the world.


    Throughout most of 2008, the U.S. cheese markets were protected by an unusually weak USD which made U.S. cheese cheap on the global market. Dairy producers responded by increasing herd sizes and, thereby, increasing milk production.


    The next chart (below) breaks the overall chart (above) for cheese production into its U.S component and the non-U.S component. Both were above the "normal" growth line, but the non-U.S. production was significantly higher (above the long term growth line) than the U.S. cheese production.

    So what countries were responsible for this spurt in the growth of cheese production? The U.S. neighbors, Mexico and Canada, have steadily increased production but in an orderly manner, staying close to the long term growth line.


    Australia has been erratic, but was below the long term growth line for 2007 and 2008.


    The EU27 do not have 40 years of accurate data, but when the 10 years of available data is reviewed, the problems do not seem to be in the EU.


    So what countries does that leave? Argentina, Brazil, and New Zealand are significant contributors to the oversupply of cheese.


    What does all this mean?

    Given that cheese is a global commodity with standards and interchangeability, the conclusions can only be analyzed in the global market.


    The U.S. is cutting back milk production primarily by reducing cow numbers. By sometime in early 2010, cow numbers in the U.S. will probably be back to the early 2007 levels. Will this solve the problem?


    As long as there is global excess, the problem will not be solved. There will continue to be too great a supply for the global demand. Prices may improve, although not drastically, until the global equation of supply and demand comes into balance. A return of the weak dollar could temporarily help the U.S., but would probably be temporary.


    The only way to win is for the U.S. to become the most efficient cheese making force on the face of the earth. Capitalist ways will bring this about, but it will be painful for the dairy industry. Milk producers must learn how to produce milk protein at the lowest possible cost and cheese making and cheese logistics must become extremely efficient. Genetics, feed, and geography are a few of the key variables.


    The U.S. has not consistently won the global price wars. Steel, automobiles, clothing, and information technology are just a few of the industries that have lost to global competitors.


    So who is coordinating the efficiency effort for the U.S. dairy industry?