Tuesday, November 24, 2009

Too Many Heifers - Too Many Lactating Cows - Too Much Cheese

The number of lactating cows is decreasing quickly to bring balance between supply and demand. The number of cows peaked in the second quarter of 2009 and has started a nose dive that will continue through most of 2010.


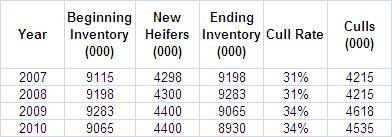
In the last three years, the availability of replacement heifers has increased nearly 6%, probably the result of sexed semen.


More available heifers is a blessing when herds are increasing in size, but when herds are decreasing, the old "ladies" have to go to make room for the young "ladies". The combined impact of the decrease in the number of lactating dairy cows and the increase in replacement heifers will have a sizable impact on the overall national cull rate.


This cull rate (both voluntary and involuntary) represents over half of the cows that are in their second and later lactating cycle. With this high cull rate, the quality of the remaining cows should improve which will probably increase milk per cow. It also means that low producing cows will probably last through only one lactation period.

Many of the parameters for improved dairy profitability are on positive trends. However, before real and lasting recovery can be achieved, three excesses must be corrected.

  • Too many heifers

  • Too many lactating cows

  • Too much cheese in inventory
  • Thursday, November 19, 2009

    What Makes Demand Vary More? Cheese Consumption or Exports/Imports

    In the November 15 post, the variation in per capita consumption of cheese was discussed. The variation from the long term trend in cheese consumption was caused by higher milk prices and was the largest variation in nearly 40 years.


    From peak to low, the variation was 2.7% from the trend line.

    In this post, we'll compare that variation in demand with the fluctuations in demand caused by variations in imports and exports. There are only two factors that make up the demand for U.S. cheese, U.S. consumption and imports/exports.

    Imports have seen a 3.25% variation in the last 2 1/2 years. This percentage is based on the same scale as the per capita cheese consumption; percent of consumption. Therefore, the 3.25% variation is exactly comparible to the 2.7% shown above for variation in consumption.


    When we look at exports, also measuring variation as a percent of consumption, we see another 2% variation.


    The combined impact of variations in imports and export is over 5%, nearly double the variation in U.S. consumer demand.

    The conclusion we can draw from this is that the biggest impact on the demand for U.S. cheese comes from the U.S. ability to compete for cheese sales on the global markets with the purpose of increasing exports and decreasing imports. The ability to compete successfully for global cheese sales is the key to demand and increased demand has a positive price impact on U.S. produced cheese. Effort needs to be focused in this area for long term success.

    In the next post we'll look the the milk supply side. How many cows will there be in 2010 and how much milk will be produced?

    Sunday, November 15, 2009

    What Influences Cheese Consumption?

    What makes U.S. per capita cheese consumption change? In the July 26 post to this blog, we examined the link between recessions and changes in cheese consumption. Upon review of the history of recessions and cheese consumption, there is no indication that people eat less cheese in a recession than at other times.

    However, in 2008 and early 2009, cheese consumption did decrease significantly. This post examines the link between cheese consumption and cheese prices. Is there price elasticity? As cheese prices increase, does demand slacken? As cheese prices decrease, does demand increase? The graphs below indicate that there is in fact price elasticity of demand. When the prices move up significantly, the growth in per capita cheese consumption goes down.

    The biggest increase in cheese prices in the last 30 years occurred in 2008. Cheese consumption actually decreased from 2007. This same pattern has occurred other times over the last 30 years.


    This clearly shows that when milk prices increase to historic highs, retail cheese prices will follow and consumption will take a hit.

    Many things caused the 2008/09 dairy economic disaster.

    • A strengthening of the USD caused U.S. cheese to be expensive on the global market and exports decreased.
    • A weak New Zealand dollar made New Zealand cheese "cheap" on the global market and U.S. imports increased.
    • U.S. retailers increased cheese prices dampening consumer demand for cheese.
    • The U.S. Dairy industry increased the number of cows significantly and brought milk production to all time highs. This was at a time when demand for U.S. cheese was decreasing.

    The chart below shows the consumer price index for cheese from 1980 through September, 2009. The 2008/09 bubble can be clearly seen. As of mid 2009, cheese prices are back to their historical pricing levels.


    Examining the last three years more closely (the area in the box on the above graph) we can clearly see the bubble and the current pricing. The current pricing should bring cheese consumption back to normal growth levels if historic relationships prevail.


    There are two important lessons to learn from this.
    1. Very high milk prices will lead to very high cheese prices and demand will fall.
    2. Cheese consumers are sensitive to cheese prices and will reduce consumption with a significant increase in prices.

    The U.S. dairy market is on it's way to recovery. In previous posts we have established that the Dairy business is global and influenced by global factors. In a global market, the low cost producer will win. Low cost milk protein is the key to low cost cheese.

    Which cheese demand factors are the most important? The import/export markets or U.S. consumption? The comparison will be made in an upcoming post to this blog.