
The year of 2015 was primarily a transition year for the U.S. dairy industry. International events slowly took hold of the U.S. dairy industry and by year end, prices were equalizing with international markets. Details on 2015 are covered in two posts:
Part One - International Factors
Part Two - Domestic Factors
Together they review the primary events that influenced domestic U.S. producer milk prices in 2015,
Monday, February 22, 2016
2015 Review - Part Two - Domestic U.S. Factors
In Part One, international factors impacting U.S. producer prices were reviewed. In Part Two, U.S. domestic factors will be reviewed. The review will include production, inventory levels, and domestic consumption of the key dairy products. The key products that influence producer milk prices are cheese, butter, dry sweet whey, and nonfat dry milk. The most important is always cheese and will be reviewed first in this post. Each of the above dairy products share some common issues, but each is also uniquely different.
Cheese influences producer prices the most. Cheese in 2015 can be characterized as low exports compared to 2014, normal to high increases in domestic consumption, low prices, and over production.

Cheese consumption does have elasticity of demand, meaning that if the price is lower, more is consumed and if it is higher less is consumed. The lower prices experienced in 2015 (the red line below) have resulted in a higher growth rate of per capita consumption (the blue line). (For more on this relationship, see the November 15, 2009 post to this blog.) This is indeed good news in terms of increased demand from the largest sector, domestic consumption.

The bad news was explained in Part One. Export demand has fallen significantly and imports have increased, offsetting the gains in domestic consumption.
However, production of cheese has continued with an expectation of rising demand from both exports and domestic consumption. Throughout ever month in 2015, cheese production exceeded the prior year.

In a review of the long-term trends (chart below), a similar picture is seen. The concerning factor is that the increase from prior year is not lessening, but appears to be growing.

This can only result is one thing, rising inventories. With rising domestic inventories, cheese prices have declined.


Regardless, this is a very significant trend that is putting pressure on supplies. The chart below shows the trends in butter churning in the U.S. The trend is clearly not consistent with the increased per capita consumption of butter..

Domestic use of nonfat dry milk has remained steady in 2015. No major change is expected in 2016. Nonfat dry milk is used in many manufactured products to improve taste and increase protein content. It can be shipped affordably and it's use is fairly insensitive to price. That simply means that at a lower price that prevails today, there is little change in domestic usage. Due to adequate refrigeration in the U.S. there is little consumer demand for nonfat dry milk.
Dry sweet whey usage domestically is similar to nonfat dry milk. As export demand has softened for dry sweet whey, less whey is dried. When prices are as low as they were in 2015, drying costs can eat up any profit potential.

Dry whey inventory is up slightly in 2015, but is still at a manageable level. Changes in total demand are influenced primarily by international demand. Expect little change in 2016.
SUMMARY
All of the data reviewed in the two posts covering 2015 suggest little change in 2016. The year 2015 was really a year of blending U.S. dairy analytics into the international dairy dynamics. The year end prices for Class III milk will likely prevail through most of 2016. Butter prices are likely to drop although this is not currently shown in the futures market. Cheese prices are at risk of higher inventories (and lower cheese and Class III milk prices) unless production is curtailed.

Future 2016 developments will be followed in this blog.
Cheese influences producer prices the most. Cheese in 2015 can be characterized as low exports compared to 2014, normal to high increases in domestic consumption, low prices, and over production.
Domestic per capita consumption has continued its normal growth rate of about 2% per year. The chart below shows the growth in per capita consumption over the last 45 years. The growth has been steady and shows no sign of plateauing. The current consumption rate is well below the levels of long-term cheese consuming countries like France, so there is little concern of leveling off in the future.

Cheese consumption does have elasticity of demand, meaning that if the price is lower, more is consumed and if it is higher less is consumed. The lower prices experienced in 2015 (the red line below) have resulted in a higher growth rate of per capita consumption (the blue line). (For more on this relationship, see the November 15, 2009 post to this blog.) This is indeed good news in terms of increased demand from the largest sector, domestic consumption.

The bad news was explained in Part One. Export demand has fallen significantly and imports have increased, offsetting the gains in domestic consumption.
However, production of cheese has continued with an expectation of rising demand from both exports and domestic consumption. Throughout ever month in 2015, cheese production exceeded the prior year.

In a review of the long-term trends (chart below), a similar picture is seen. The concerning factor is that the increase from prior year is not lessening, but appears to be growing.

This can only result is one thing, rising inventories. With rising domestic inventories, cheese prices have declined.

The futures markets are not predicting a further fall in cheese prices, which implies that inventories will not increase further. However, this can only happen if less cheese is produced in early 2016. Stay updated on this very important parameter as analytics are reviewed in future editions of this blog.
Butter consumption has turned around after years of decline and is increasing in terms of domestic per capita consumption. This increase may be expressing a consumer trend toward "natural" products.


As a result, the shortfall in butter supply has brought significant increases in imports. No announcements of increased churning capacity have been announced, and to date, butter futures have maintained a level consistent with current prices. The current domestic butter prices remain well above international prices, so the shortfall in supplies will have to be maintained with imports.
Domestic use of nonfat dry milk has remained steady in 2015. No major change is expected in 2016. Nonfat dry milk is used in many manufactured products to improve taste and increase protein content. It can be shipped affordably and it's use is fairly insensitive to price. That simply means that at a lower price that prevails today, there is little change in domestic usage. Due to adequate refrigeration in the U.S. there is little consumer demand for nonfat dry milk.
Dry sweet whey usage domestically is similar to nonfat dry milk. As export demand has softened for dry sweet whey, less whey is dried. When prices are as low as they were in 2015, drying costs can eat up any profit potential.

Dry whey inventory is up slightly in 2015, but is still at a manageable level. Changes in total demand are influenced primarily by international demand. Expect little change in 2016.
SUMMARY
All of the data reviewed in the two posts covering 2015 suggest little change in 2016. The year 2015 was really a year of blending U.S. dairy analytics into the international dairy dynamics. The year end prices for Class III milk will likely prevail through most of 2016. Butter prices are likely to drop although this is not currently shown in the futures market. Cheese prices are at risk of higher inventories (and lower cheese and Class III milk prices) unless production is curtailed.

Future 2016 developments will be followed in this blog.
Tuesday, February 16, 2016
2015 Review - Part One - International Factors
The year of 2015 was a difficult year for producer milk prices. There are many reasons for this. The year 2015 will be reviewed in two separate posts, the first dealing with international factors, and the second post dealing with domestic U.S. dynamics. The international post will be presented first, because it has created the most volatility and had the greatest influence on the depressed domestic producer milk prices. Just like many other commodities, milk is now an international commodity, and international events and international supply and demand influence milk prices around the world.
The table below shows the 2014 prices compared to the current global prices for cheese, butter, and skimmed milk powder/nonfat dry milk.
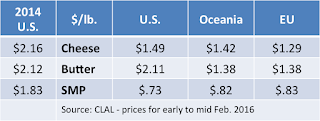
In 2014, the wholesale price of cheese was $2.16/lb. as calculated by NASS. Today, U.S. cheese is worth $1.49/lb. and European cheese is worth $1.29/lb. Skimmed milk powder/nonfat dry milk was worth $1.83/lb. in 2014, and today it is worth $.73/lb. in the U.S. and slightly more in other parts of the world. That is less than half the price of a year ago. U.S. Butter has retained amazing price resilience maintaining a price point equal to 2014 and significantly above international prices.
These changes are driven by many factors. which will be covered below. Today, it is cheaper to buy butter internationally than to buy butter churned domestically. These commodities plus dry sweet whey are used to price producer milk. The factors driving these lower prices globally are as follows:
- Russia's ban of dairy products has hit EU dairy producers and processors very hard. Prior to August 2014, approximately 1/3 of of EU cheese was exported to Russia. Note above, that EU cheese is now very low priced in order to move volume. Because of the strong USD, U.S. cheese is expensive, and EU cheese is taking market from the U.S. in Japan and in the U.S. Butter is facing a similar fate as nearly 40% of EU butter was exported to Russia prior to the ban. Butter inventories in the E.U. are very high and export prices are very low. The Russian ban will last through August of 2016. What will happen then is unknown. For at least most of 2016, this situation will keep E.U. dairy products low priced while they try to find a home for this excess production.
- China is importing less Whole Milk Powder (WMP) and therefore New Zealand is shifting this excess milk to cheese manufacturing, again putting pressure on global cheese stocks. Here again, the U.S. is being hurt by the strong USD. New Zealand is expected to reduce herd sizes and reduce some of this excess milk, primarily reducing cheese production. Also, because China is importing less WMP, the EU is shifting to more Skim Milk Powder and butter, increasing global availability of these products.
- In all of the above, the strong USD is making U.S. exports difficult.
A review of the major export categories follows. Cheese will be reviewed first as the pricing of cheese is the most important input to the Class III milk formulas.

Cheese exports are down 14% in 2015 after five years of significant growth. Cheese imports are also up significantly in 2015

As a result, the net cheese exports (exports-imports) are down considerably in 2015. As a result, U.S. stocks of cheese are reaching high levels as reviewed in the prior post, and with high inventories, prices fall for cheese and, by formula, for Class III milk.

How have U.S. cheese exports changed? Below is a graph comparing 2014 and 2015 exports.

Mexico is the only significant growth country for cheese exports. Further growth in cheese exports to Mexico is expected in 2016. As mentioned above, lower prices from the EU and New Zealand have taken market from Korea and Japan.
On the import side, imports to the U.S. from the EU and New Zealand have increased, reducing net exports and increasing stocks of cheese in the U.S.

U.S. domestic consumption, the other part of the total cheese "disappearance" analysis will be reviewed in the next post to this blog.
U.S. butter pricing has followed a very unusual path. As noted in the table above, U.S. butter prices are well above competitive butter prices. As a result, there are almost no exports. Butter priced well above butter from the EU and New Zealand will not sell. Also, churning production is down and there are no available stocks to export.

However, to reach U.S. consumption levels, butter must be imported. (See more on U.S. consumption trends in the next post.) And, with lower international prices, imports have escalated to levels not seen in 10 years.

As a result, the U.S. has become a net butter importer. As long as the huge difference in prices between the U.S. ($2.11/lb.) and international prices ($1.38/lb.), the trend toward more imports will continue. U.S. butter prices will fall in 2016.

Who is providing the butter that is imported into the U.S.? It's quite a mixture; Ireland, New Zealand, Mexico, France, etc.

Nonfat Dry Milk/Skim Milk Powder (NDM/SMP) has had an amazing 2015, at least in terms of volume. In spite of huge international pressures, NDM/SMP has stayed at nearly constant export volumes over the last three years. In fact, 2015 was a new record for exports of NDM/SMP. Unfortunately, pricing was way off, down 60% from 2014.

Surprisingly, imports were also up,

This left the balance on net exports down slightly from prior years.

Mexico is importing NDM/SMP and reconstituting it for distribution to low-income families. In Mexico, low-income families represent a huge market. These exports of NDM/SMP to Mexico are expected to maintain the current volumes in 2016. Sales of NDM/SMP to other countries are very small and may present a volume opportunity in 2016 if low pricing in maintained.

Exports of dry whey were down 22% for 2015, with most of the fall occurring in the second half of the year. As a result dry whey exports accounted for only 40% of dry whey production in 2015 vs. 58% in 2014.

In summary, exports have all been under great pressure for the reasons mentioned above. Little change is expected in 2016. In the next post, 2015 dynamics of the domestic U.S. dairy market will be reviewed.
Sunday, February 7, 2016
Prices Continue Downturn
On February 3, 2016, Class and Component prices for January were announced. As predicted in prior posts, butter prices fell significantly. Global prices for butter are still well below U.S. domestic prices so additional declines in butter prices can be expected. Currently international prices for U.S. butter are $1.70/lb. compared to the $2.18/lb. for U.S. NASS butter prices. Milk protein prices increased by 33.6%, solely because of the decrease in butter prices.
Class III milk prices were down 5% to $13.72/cwt. Any improvement to this price will depend on the wholesale price of cheese, which is influenced by domestic inventory levels of cheese. Domestic inventory levels are in turn largely influenced by cheese exports. As covered in the prior post, U.S. 2015 exports of cheese are down in all countries except Mexico.

The pie chart showing the breakdown of component values in the Class III price still shows butterfat providing the most value although it is shifting more toward milk protein. In November butterfat made up 73% of the milk check. Currently, it makes up 59%. Expect this trend of falling butterfat prices and escalating milk protein prices to continue.

Other Solids made up only 1%, or $.21/cwt. of milk. Other solids is priced based on the value of dry whey which has dropped in price with a significant decrease in exports. The latest data shows that 32% of dry whey is being exported compared to 51% a year ago.
CHEESE
Cheese is the most important parameter in the pricing of Class III milk. Cheese exports are the most volatile component of cheese demand. Cheese exports were 5.2% of production in November 2015, the most recent data. For the year of 2014, exports represented 7.2% of production.
However, production of cheese continues at the normal growth rate without any adjustment for the decrease in exports.

As a result, cheese inventories are growing. The growth is approximately equal to the decline in exports of cheese. Clearly, no decrease in production has been made to compensate for the drop in export demand. It is unlikely that cheese exports will rise significantly in the coming months and if production of cheese does not decrease, the inventories will continue to grow. As the inventories grow, the wholesale cheese price and the Class III price will decline. Declining cheese exports and continued high production are the biggest factors in the declining Class III milk prices.


BUTTER
Butter has had an unbelievable run. In September of 2014, butter hit $2.85/lb. and in November 2015 it was valued at $2.80/lb. The current price of $2.08/lb. is well below these highs, but is still high compared to historical levels and international values.

While butter inventories are still in line as shown in the chart below, international prices are well below current domestic NASS prices. Exports of U.S. butter are nil because the domestic price is still well above the international prices. Imports of butter continue to climb and production of butter in the U.S. remains stagnant.

Production of butter has remained consistent year-to-year for five years while domestic consumption has increased.

In order to meet the domestic demand for butter, imports have increased tremendously as shown in the chart below.

Logic says that if these trends continue, domestic butter prices will continue to fall until they reach equilibrium with international prices. During that time imports will continue to grow.
These trends for butter have little impact on the Class III prices (see a prior post for the math behind this) but will continue to shift the mix of making up the Class III price. Butterfat will constitute a lower percentage of Class III price and milk protein will make up a larger percentage.
NONFAT DRY MILK
Nonfat dry milk is the basis of the Class IV price. The Class IV price can also influence the Class I and Class II prices. Nonfat dry milk is unique in that export volumes are strong and larger than prior years. Unfortunately, prices are not as strong as prior years. The current price of $.78/lb. is far below the $2.08/lb. of March 2014.

The good news is that with the strong exports, inventories have remained in balance. Only a change in the international value will change the domestic price of nonfat dry milk.

For a review of how nonfat dry milk influences producer cash flow, see the July 16, 2014 post to this blog.
WHOLE DRY MILK
One interesting growth product for the U.S. is dry whole milk. Whole dry milk is much more difficult to package than nonfat dry milk. Whole milk contains fat that can become rancid as the fat molecules accept oxygen from the air. Whole dry milk is typically packaged in cans or other materials that are good barriers for limiting oxygen transmission and the container is nitrogen flushed to remove oxygen in the container. China has been a huge buyer for dry whole milk, but this market has decreased. Nevertheless, the trend for production of dry whole milk continues its growth, which has doubled production over the last nine years.

The production of dry whole milk, while still far below production of nonfat dry milk, is creating another outlet for U.S. dairy products. This growth will continue to be followed in future posts to this blog.
The next post will provide a summary of the year of 2015.
Subscribe to:
Posts (Atom)