Monday, August 28, 2017

Where is Butter Going?

Butter prices are extremely high and cheese prices are "moderate."  When cheese prices are "moderate", milk prices are "moderate." But the high price of buttert has caused a major distortion in the value of milk protein and butterfat.  This post will review some of the fundamentals driving these results.  In the most recent month, milk protein was worth $1.22/lb. and butterfat was worth $2.95/lb.

The most recent data lags in publications from government sources and often later contains adjustments after the initial publishing.  Some of the most recent data shown in the charts below was developed from the currently available data, and may show some adjustments in later publications.

The prior blog covered some of the elements concerning exports and imports of dairy commodities.  This post will focus on domestic consumption.  The definitions behind these numbers can be obtained in this USDA publication.  Statistics defined as consumption or per capita consumption, are technically defined as availability.  This simply is meant to state that consumers are not surveyed to see how much cheese they left of their plate or how much butter was on toast that was not eaten, etc.  Availability simply means that the item was available for consumption and includes any final waste.  The data for 2017 is based on actual data for the first seven months and the USDA projections for the remainder of 2017.

Another term often used by economists is "price elasticity of demand."  This simply means that if something increases in price, consumption will go down and vice-versa.

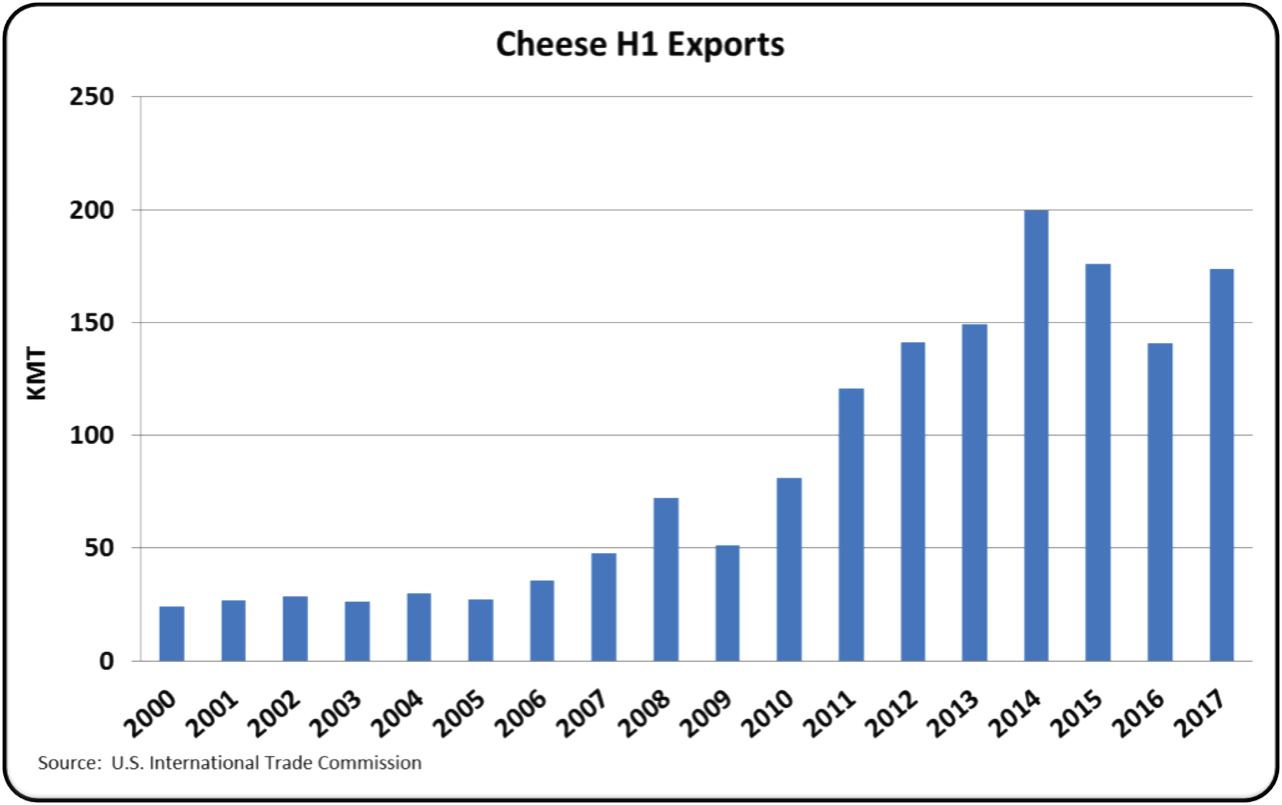
Cheese consumption has been increasing for a very long time.  This has occurred not just in the U.S., but also in other part of the world.  Countries like France eat more cheese per capita than the U.S. which simply means that there is still lots of room for increasing cheese consumption in the U.S..  The increase has typically varied between two and three percent per year.   So, the trend for increasing cheese consumption seems to have almost no upper limit.  Cheese is eaten as a stand alone food item or used as an ingredient in other food items.

Chart I - Cheese Consumption
The trends in butter consumption in the U.S. are a little different.  During WW II, butter demand far outstretched supply.  Substitutes were developed primarily based on vegetable oil.  Some of these were horrible, but with no butter available, citizens had to settle for "substitutes."  Over-time, the substitutes were improved and priced competitively and became accepted in everyday use.

Chart II shows the growth in butter consumption.  After a terrific fall in the 40's and 50's consumption was relatively flat until the 2000's. Around ten years ago butter consumption started to increase at a faster rate.  There appears to be two major reasons for this increase.  The melting point of vegetable based spreads was largely controlled by partial hydrogenation, which was deemed to be a health hazard.  This practice has changed, but concerns still linger about these vegetable spreads.  There has also been a movement of increasing concern over "processed" foods and a trend to more "natural" and "organic" foods.  Companies like Whole Foods, recently acquired by Amazon, have developed a business on what was a niche and is now a substantial business.   As covered in an earlier post to this blog, butter consumption is now growing at a higher percentage than cheese consumption.

Chart II - Butter Consumption
The trend for increased consumption of butter is around ten years old.  The increased consumption of cheese has been going on for much longer, perhaps a century or more.  The continued growth of cheese is very likely.  The continued growth of butter may be a trend that may reverse in the coming decades.  Who knows when publicity about butter may be loaded with stories about cholesterol, caloric value, or other concerns?

Butter is primarily butterfat, with water and typically has salted added.  Cheese is a combination of milk casein protein and butterfat in fairly equally amounts (typically a little more butterfat than protein), with water, salt, a perhaps a few other ingredients added.  When making cheese, only whey is left as a by-product, but with butter, a lot of skimmed milk is left.  U.S. consumption of skimmed milk is small and decreasing, leaving only the export market to help the disappearance of skimmed milk.  Some nonfat dry milk will go to "spike" protein for cheese making, but that will not begin to absorb the supply.  If the domestic and global demand for butter continues to grow, it will undoubtedly create a glut of nonfat dry milk and skimmed milk powder which will further reduce the Class IV milk price.

Currently, about 12 billion pounds of cheese are consumed in the U.S.  By comparison, there are 2 billion pounds of butter consumed.  Currently butter consumption is growing faster than cheese consumption by percentage, but the actual pounds of growth are much greater for cheese than butter.  It is important to note, that milk protein is needed to make cheese.  While right now, milk protein is priced fairly low, but the growth of cheese will again put pressure on the need for milk protein.

At the beginning of this post, there was a comment about "elasticity of demand."  Typically in the past, the increases in cheese consumption have dipped only when prices were high, which shows that cheese has "price elasticity of demand."  There is not a long sustained growth in butter consumption vs. price to accurately measure this same scenario.  However, currently the retail price of butter is very high.  The far right end of Chart III would suggest that butter consumption might be falling with the current high prices.  The blue price line in the chart below is based on the NASS wholesale price of butter.  With a sustained high price for butter, domestic disappearance seems to be dropping.

Chart III - Butter Price vs. Disappearance
This blog reports primarily events that influence U.S. producer milk prices.  Based on the above, how do these events impact producer milk profits?
  • First of all, increased butter consumption and increased butter prices do not lead to significant increases in producer milk prices.  A higher butter price only changes the makeup of the Class III price from being dominated by protein to being dominated by butterfat.  By the Federal Milk Marketing Order formulas, a higher butter price increases the value of butterfat and lowers the price of milk protein.  The change to the Class III price is minimal.  See the detail of this in a prior post.
  • Unfortunately, many of the current dairy publishers do not seem to have a good understanding of how the Federal Order formulas work and keep publishing how much the current butter prices are boasting milk prices.  This is fake news.
  • If butter consumption both domestically and globally continues to grow and cheese domestic consumption and exports do not provide a sufficient market for cheese production, it will tend to keep cheese prices "moderate" and the Class III price at the current "moderate" levels as well.  What is needed to increase producer milk prices is increased cheese disappearance through both domestic consumption and exports.  This will increase demand, lower inventories, and improve milk prices.
  • Butter consumption will probably drop with the current high prices.  This will tend to "right" the market with lower butter consumption both domestically and globally and reduce butter prices.  This will directly impact the butterfat price.


Sunday, August 13, 2017

Great H1 for exports, however, June cheese and NDM exports are down

Dairy exports showed some weakness in June, but from a broader perspective the first half of 2107 was up considerably over the prior year.  Butter exports were up 35.9% from May, but it was on a very small base.  With the domestic shortages and tight inventories, it would be difficult to export any significant amount of butter.  Exports of cheese, nonfat dry milk (NDM), and dry whey were all down versus the prior month.
Chart I - Export Changes from Prior Month
As mentioned in the July 9 post to this blog, long-term increases do not typically occur with increases each month.  Long-term increases always have ups and downs.  The upward trend for cheese exports started in October 2016 and has continued to grow reaching a near record level in May 2017.  If there is another downturn in August, that could be concerning, but the one month decrease is normal for an improving market.  There are now nine months of data supporting an upward trend in cheese exports.

Chart II - Monthly Exports of Cheese
Cheese exports for the first half of 2017 were close to the second best ever.  Cheese exports are the most important parameter for insuring that there is a sufficient market for the cheese being produced. Without a sufficient market, inventories will increase and prices will fall.  With lower cheese prices, Class III milk prices will also fall as well as the uniform milk price.

Chart III - Cheese Exports for January through June
NDM exports are the backbone of U.S. dairy exports.  It is by far the largest export category and the U.S. is the world leader in NDM exports (see prior post).  June exports fell significantly.  As with cheese, one month of data, although troubling, does not define a long-term problem.

Chart IV - Monthly Exports of NDM
For the first half of 2017, exports of NDM were about even with the record year of 2014.  Unfortunately, prices were much lower than 2014, but the volume has helped in keeping demand for dairy products closer to supply.

Chart V - NDM Exports for January through June

Exchange rates are continuing to show a weaker USD, which will help increase exports by making U.S. products less expensive in the international market.

 When the chart charts below show an increase, the USD is weaker and U.S. export products are more competitive.  The two largest export competitors in the international markets are Europe and New Zealand.  (More detail is available in the July 28 post.)  In the two charts below, there is a trend toward a weaker USD and a stronger Euro and NZD.

Chart VI - Exchange rates for the USD vs. the Euro
Chart VII - Exchange Rates for the USD vs. the NZD
Mexico is by far the largest export market for U.S. Dairy products.  The Mexican Peso is gaining strength against the USD,  which in turn is making U.S. dairy products more financially attractive in Mexico.  This is another very positive sign for U.S. dairy exports.

Chart VIII - Exchange Rates for the USD vs. the Mexican Peso
Exports to Canada are not typically significant as Canada is not a NAFTA open border for dairy products.  However there has been a great deal of press concerning a possible renegotiation of NAFTA.   It seems unlikely that Canada will open their market for dairy imports.  However, if this did happen it could have a very strong and positive impact on U.S. dairy exports.  The exchange rate of the USD/CAD could be very important and it is currently showing a weaker USD and a stronger CAD.

Chart IX - Exchange rates for the USD vs. the CAD
While June exports has some disappointing analytics, the longer-term view shows very positive trends.  The data for July, which will be ready in a few weeks, should tell a lot.

Sunday, August 6, 2017

Milk Protein hits 16 year low, Butterfat Prices Near Record

July Class and Component milk prices were announced on August 2.  The class III milk was down $1/cwt. to $15.42.  Milk protein hit a 16 year low and butterfat is at near record highs.

Chart I - Price Movements for July vs. the Prior Month
As shown in Chart II below, the price of milk protein has not been this low since the start of 2001.  The value of milk protein for July is $1.22/lb.  This compares to record highs for milk protein at nearly $5.00/lb.  Butterfat in July was worth $2.95/lb., near the all-time records which are just above $3.00/lb.
Chart II - Long-term Trends
With these abnormal prices, July's butterfat contribution to the milk check jumped to 67%.  July is a record setting month, but only because of the extremes in pricing.

Chart III - Pie Chart of Class III price
What caused these extremes?  Cheese prices were down only 5.3% in July, but protein prices went down 30.2%.  Frankly, it's surprising that cheese prices went down at all.  Exports of cheese are improving (see July 9 post) and inventories are declining (Chart V below).  Typically, this scenario causes an increase in cheese prices.  For that reason, the 5.3% dip should be taken as a normal fluctuation, not a trend.  

The real reason for the big dip in protein prices is the increase in butter prices.  When butter prices go up, the value of butterfat goes up, and the value of milk protein goes down.  There are many published articles stating how much money producers are making from the increase in butter prices.  However, butter prices do not drive higher milk checks.  The Class III hardly changes when butter increases in value.

The formulas behind this are shown below.  The price of butter influences both the formulas for butterfat and milk protein.

Butterfat Price = (Butter Price − 0.1715) x 1.211) 

Protein Price = ((Cheese Price − 0.2003) x 1.383) + ((((Cheese Price − 0.2003) x 1.572) − Butterfat Price x 0.9) x 1.17)

If one collapsed the protein price formula, to its simplest terms it would be as follows:

Protein Price = Cheese Price x 3.22 - Butter Price x 1.28 - $.42

In July, the cheese price was $1.54/lb. and the butter price was $2.60/lb.  Because the butter price has a negative influence in the formula, it significantly drove down the value of milk protein.

The chart below shows the cheese and butter prices since the beginning of 2000.  There have been a few times in the past when butter was worth more than cheese, but they were short-term spikes. However, starting in 2015, butter prices shot up.   During that same period, cheese prices have been moderately low.  In July, this reached an extreme point with very high butter prices and very low cheese prices.

Chart IV - Cheese and Butter Prices
A high butter price moves the money from protein to butterfat, but has a small impact on the overall milk check.  (See more detail on this relationship in a prior post.)

July's pricing was an extraordinarily unusual event and extraordinarily unusual events don't typically last. It would not be wise to make long-term decisions based on Pie Chart III above.   Retail prices for butter are very high, and high retail butter prices will reduce domestic consumption as some consumers change to lower priced vegetable spreads.  With reduced consumption, inventories will grow and domestic prices will fall.  The future's market is indicating a 10% increase in cheese prices by the end of 2017, and a 10% decline in butter prices. This would bring the milk protein price back to $2.00/lb. from the current $1.22/lb. price.

The moderately low cheese prices result from excess inventories and the excess inventories are caused by lagging export volumes of cheese.  However, as covered in a prior post, cheese exports are growing quickly and inventories are starting to fall.

Chart V - U.S. Cheese Inventories
Cheese exports for June will be covered in the next blog, but the data available indicates that cheese exports are continuing to grow at a rapid rate.

July component pricing was abnormal.  But all indicators show that more normal pricing will quickly return.