Monday, May 28, 2018

Fluid Milk Consumption Crashes

Drinking milk was originally the primary use for cow's milk.  That time has passed.  Cheese production is now the primary use of cow's milk in the U.S.  The long-term growth of domestic cheese consumption was covered in the March 31 post to this blog.  The current growth rate of domestic cheese consumption is about 2% annually.  This post will cover the growth rate of fluid milk consumption based on the most recent 2017 data.

Chart I shows the total volume of fluid milk consumed in the U.S.  For many years, the decline in per capita consumption was offset with population growth keeping the total fluid milk consumption relatively stable.  However, population growth has slowed, and the per capita consumption of fluid milk has dropped.  The growth rate is now negative.

Chart I - Annual Fluid Milk Sales
There has been no positive growth in consumption of fluid milk in the last seven years (Chart II below).  The negative growth rate of beverage milk is now increasingly negative.  In 2017, the rate of decline increased to -3.3%.  The data below shows that the negative growth rate is now accelerating.  Statistically, the current trends suggest that the negative growth rate may soon become -4% or greater annually.

Chart II - Growth of U.S. Fluid  (Beverage) Milk Consumption
How important is this?  This downward trend in fluid milk consumption drastically changes the composition of milk needed from producers.  More comments on this are included in the conclusion at the bottom of this post.  In 2017, milk used for fluid milk consumption, Class I milk, was the second largest category (Chart III).  Shrinkage in the Class I category will influences that overall domestic use of producer milk.  (In Chart III, California is included, as it will become a Federal Order by the end of 2018.)

Chart III - 2017 Milk Volumes by Class
The makeup of milk is also drastically changing.  Turning the calendar back 50 years, whole fat milk was about all there was.  Then, as consumers became more calorie conscious,  2% fat milk grew as well as 1% fat milk and skim milk.  That trend has reversed in the last five years and butterfat has been shown to have important properties.  Butterfat is now recognized to help certain body functions, not just add calories.  In 2017, the volume of whole milk was again up over the prior year gaining 2.6%.

Chart IV - Consumption of Whole Fat Milk
Milk with 2% fat was the most popular milk in 2016.  The trends toward whole milk changed that.  In 2017, 2% fat milk down 5% in volume.  The most popular milk is now whole fat milk

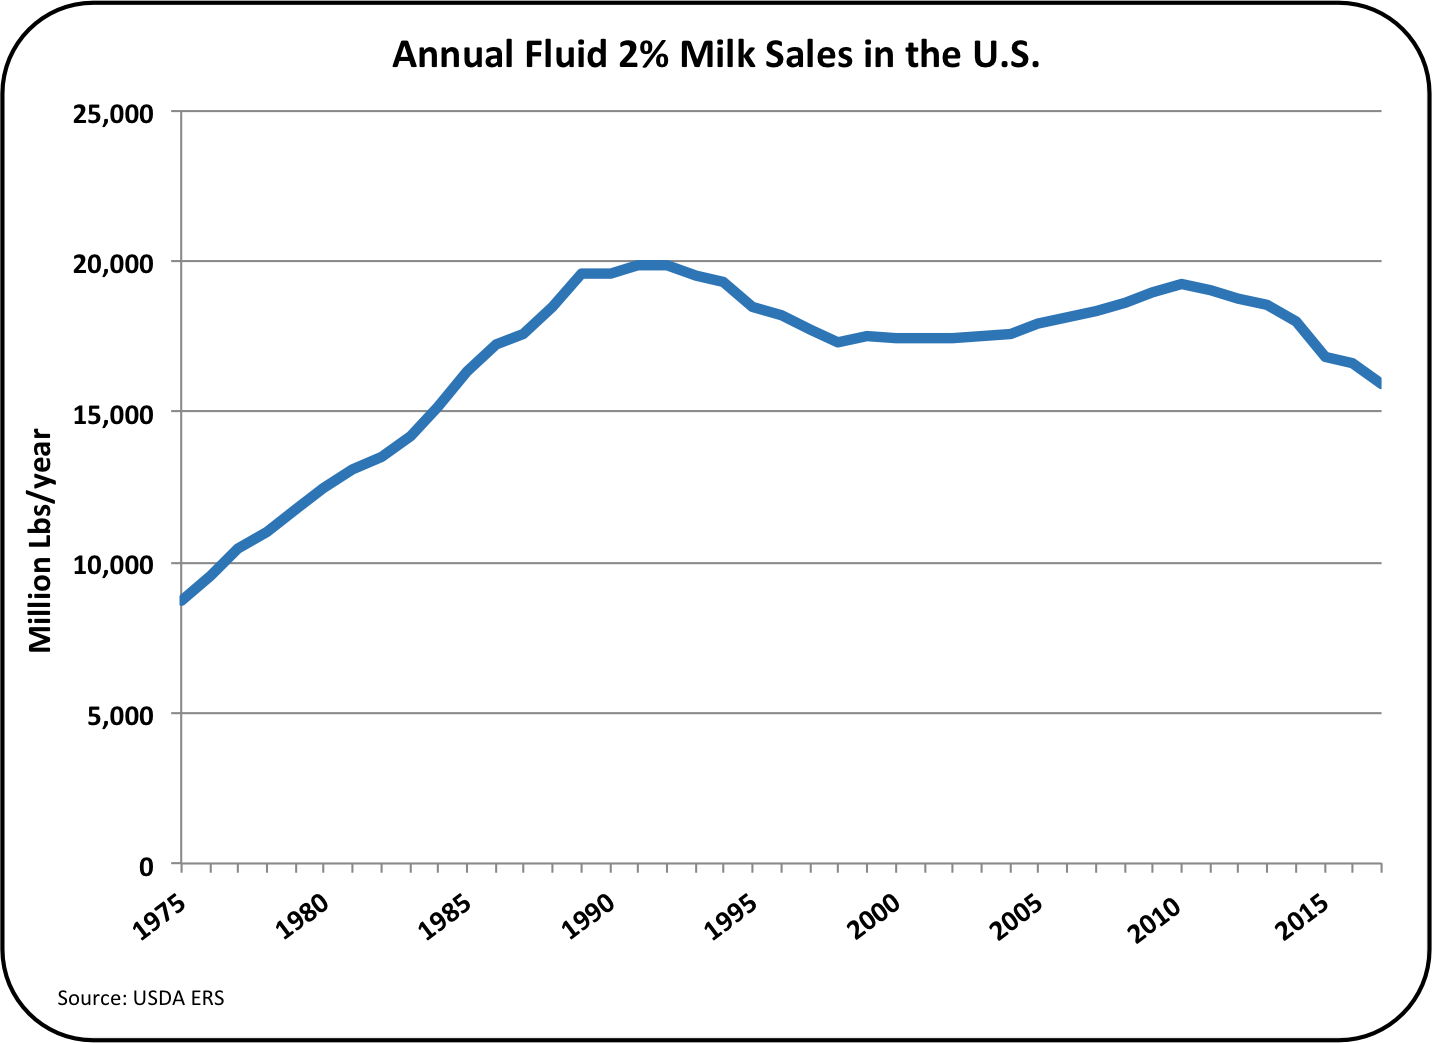
Chart V - Consumption of 2% Fat Milk
Milk with 1% fat dropped by 9% in volume in 2017.  This change follows the overall trend to milk with more butterfat.

Chart VI - Consumption of 1% Fat Milk

Skim milk continued its drastic fall.  In 2017, it fell by 13% from the prior year.  Over the last eight years, it has fallen by 48%.

Chart VII - Consumption of Skim Milk
Adding all the types of milk together, total fluid milk consumption fell 3.3% in 2017 vs. the prior year.

The increased consumption of butter covered in the March 31 post to this blog is only one factor in the overall consumption of butterfat.  The changes in consumption of fluid milk with less butterfat being removed has also put pressure on the butterfat supply.  In 2017, whole milk made up 34% of the total milk, 4% higher than the prior year.

Where is this trend going?  If milk consumption continues to drop by 3.3% per year, fluid milk demand will drop by another 30% over the next 10 years.  In the case of fluid milk, export help is minimal as shipping all the water in whole milk very far is cost prohibitive.  That would make the demand for Class I fluid milk drop from being the number two category by milk class to number three.  Class IV milk which is growing would become the second largest category.  States like Florida, where fluid milk consumes nearly all the milk produced, will see a drastic change in the need for milk.

CONCLUSION

The data presented above only confirms what most readers already know.  Fluid milk consumption is continuing its slide downward.  White milk mustaches appear to be disappearing.  The new data suggests that the decline is accelerating.  In the statement in the paragraph above, a decline in demand for fluid milk in the next 10 years was estimated to be 30% based on the 2017 decline rate.  That may understate the decline which appears to be accelerating.  If the declining rate continues to accelerate, as it is now, that decline could be 35% or more over the next 10 years.

When we start to combine the domestic consumption and export trends, it becomes obvious that the productivity standard of measuring pounds of milk production is meaningless.  The only thing that is important is pounds of solids, and especially important are pounds of butterfat and protein.  While there are many statistics published on pounds of milk produced, there are very limited national or statewide statistics comparing pounds of the various solids produced.  The Federal Orders paid on the advanced system will continue to decrease in volume as fluid milk declines.  Payment by the component system will continue to grow.  Statistics on production of specific solids needs to become the standard measure of productivity.

The most difficult question to answer is how much total milk will be needed.  From prior posts, data and trends on population growth, cheese growth, butter growth, and export/import growth were examined.  The most volatile of these is exports/imports, because there are many global elements that can influence exports and imports.  Current data shows that the milk supply is growing by 1.5% annually.  Is there enough demand for all this milk?

In a June post to this blog, the factors mentioned above will be combined to form a model predicting the volume of milk/solids that will be needed going forward.  

Sunday, May 20, 2018

March Dairy Exports are Amazing!

Dairy export/import data for March is very positive.  However, even more improvement is needed to balance demand with milk production.  As shown in Chart I below, exports have risen by about 2% of total solids production in the last six months.  In October 2017 15.2% of milk solids were exported.  By March 2018, those exports have increased to 17.3% of milk solids produced.  This has helped find a home for a significant amount of U.S. milk.  But U.S. dairy inventories are still high as covered in the May 6 post to this blog.

Chart I - Dairy Solids Exported as a Percent of Production
CHEESE

Cheese pricing is key to producer milk prices.  Cheese exports have been increasing (Chart II) but are still below 2014 and 2015 levels.  March exports represent 6.8% of U.S. cheese production.  The increase in cheese exports are preventing further growth of cheese inventories, but even more exports are needed to reduce the inventory levels.  Cheese inventories are too high and that is keeping cheese prices and Class III milk prices low.  See the March 12, 2017 post for an explanation of the link between the cheese price and the Class III milk price.

Chart II - Cheese Exports
Where are cheese exports going?  Mexico is always by far the largest importer of U.S. cheese, but a lot of the growth is also coming from exports to South Korea and Japan, half way around the globe.  There have also been nice increases in cheese exports to China, Chili, and Saudi Arabia.  Diversification in the countries buying U.S. cheese should provide more long-time stability in exports.
Chart III - Cheese Exports by Country
Cheese imports (Chart IV) are at 2014 levels, and well below the levels of the last four years.  Hopefully, cheese imports will fall further in the coming months to record low levels.
Chart IV - Cheese Imports
The overall decrease in imports results from the reduced YTD imports of cheese from France and the Netherlands (Chart V), offset somewhat by increases from Italy and Denmark.  
Chart V - Cheese Imports by Country
Combining increased exports and decreased imports of cheese gives cheese net exports a nice boost for March.  Cheese net exports (Chart VI) are still below 2014 levels, but the increases from prior months and the last four years is dramatic.  March 2014 was an all time record for cheese exports and therefore set a very high comparative benchmark.  In the coming months, there is a real opportunity to set new monthly record highs of net exports of cheese.
Chart VI - Cheese Net Exports
NONFAT DRY MILK
Nonfat Dry Milk/Skimmed Milk Powder (NDM/SMP) is the largest U.S. export category. YTD 57% of U.S. NDM/SMP has been exported.  In February and March, NDM/SMP exports reached a record high.  The international market is crowded with high inventories of NDM/SMP and prices are low.  To deliver a record levels of exports in this competitive environment requires low pricing.   (See May 6 post to this blog for NDM/SMP pricing.)

Chart VII - NDM Exports
To emphasize the record exports of NDM/SMP, Chart VIII shows the growth of NDM/SMP exports over the last 18 years.  The February and March 2018 exports are not just records, but very strong new record highs.

Chart VIII - NDM Exports Since 2000
The exports of NDM/SMP to Mexico (Chart -IX) are huge and continue to grow.  Especially in the southern areas of Mexico where refrigeration for milk is limited, NDM provides an alternative that is inexpensive, can be stored without refrigeration, and can be rehydrated as needed.  The overall increase in YTD NDM/SMP exports is lead by Mexico, combined with nice increases sent to Indonesia, and Vietnam.   A favorable conclusion to NAFTA is important for the continued growth of this market.

Chart IX - NDM Exports by Country
U.S. imports of NDM are down as shown in Charts X and XI.  Most of this reduction comes from decreases in imports from New Zealand and Chili.

Chart X - NDM Imports
Chart XI - NDM Exports by Country 
The combined high exports and low imports combine to achieve record highs for NDM/SMP net exports (Chart XII below).  

Chart XII - NDM Exports
DRY WHEY

Exports of dry whey (Chart III) remain near record highs.   Dry whey is the basis of pricing for "Other Solids" pricing.

Chart XIII - Dry Whey Exports

EXCHANGE RATES

Exchange rates for the two largest international dairy competitors show a slight strengthening of the USD.  A stronger USD makes U.S. products less financially competitive.  However, the change is small, and the USD remains significantly weaker than a year ago.

Chart IXV - Exchange Rate - Euro
Chart XV - Exchange Rate -NZD
SUMMARY

U.S. dairy exports show very nice increases for the first quarter of 2018 as the USDEC continues its quest for the "next 5%."   Inventory levels remain high, but the current dairy export increases appear to have prevented further growth in inventories.  To reduce the high inventories, even higher levels of  exports will be needed.  This very important parameter will continue to be followed in the blog.

Saturday, May 12, 2018

How Much Growth In Milk Production is Needed?

This post will frame one more element in the equation of how much milk is needed in the U.S..  When there is not enough milk available to meet demand, inventories are tight and producer milk prices are high.  With high prices, producers want to expand for two reasons.  They can because they are making a lot of money, and because they want to take advantage of the high prices in the future.  Where there is too much milk available, inventories become bloated and prices are low.  Low prices drive out some of the marginal herds and balance returns.  Prices have been relatively low for the last three years, but is milk production shrinking?

Where is the demand side for milk production going?  Do we need more milk to fill demand?  Demand comes from two areas, U.S. consumption and exports.  U.S. consumption comes from per capita consumption of individual dairy products and population growth.

The U.S. government does not control milk production.  There are no government assigned quotas.  Only the economics of supply and demand manage the milk supply.  It behooves a producer to understand where some of these parameters of demand are moving.

Lets first look at milk production over the last 18 years (Chart I).  The growth of milk production has been very steady for decades.  Chart I has a trend line that follows very closely to the blue line of actual milk production from 2000 to 2017.

Chart I - Annual Milk Production
Chart II shows the annual growth in milk production as a percentage of the prior year.  Since the year 2000, Milk growth has averaged 1.5%.  Milk production increases in the last three years are also around 1.5%, but with less wild volatility than prior years.  In the first quarter of 2018 milk volume increases were again averaging 1.5%.  That is well above the population growth as shown below in Charts III and IV.

Chart II - Percentage Growth in Milk Supply
Population in the U.S. has, over the last 35 years, increased in the range of 2.1 to 3.5 million people per year.  Chart III shows the population growth from the year 2000 to 2017. Just like with milk production, the steady increase in numbers however means a lower percentage growth.


Chart III - Population Growth in the U.S.
Chart IV shows the slowing percentage of population growth.  In the year 2000, the population growth was 1.1%.  Over the last three years, the population growth has slowed to .7%.  

The difference between the current population growth of .7% and the growth in milk production of 1.5% leaves a gap of .8%.  To keep inventories in line, the difference between the population growth and milk growth has to be resolved with greater exports and/or greater per capita consumption of dairy products. 
Chart IV - Percentage Growth in Population
In the March 31 post to this blog, consumption of cheese and butter were analyzed.  Consumption of cheese has slowed to a 2% growth rate.  Butter consumption is growing by 2.6% per year.  The missing part of the domestic consumption of dairy products is fluid milk.  Per capita consumption of fluid milk consumption has been decreasing for decades.  Data for 2017 should be available very soon.   This will provide an update on how fast the fluid milk category is shrinking.

March exports and imports will be analyzed in the next post.  More insights into the trends of export volume and the breakdown by category will be covered.

Once the data for domestic per capita consumption, export trends, and population growth is analyzed, a summary will be made of how the current trends may impact the bloated inventories and producer pricing.

California will become a Federal Order toward the end of this year, so the final analysis will include California data as a Federal Order paid by the component calculations.

Sunday, May 6, 2018

Milk Prices Increase, a Little

The Class and Component prices for April were positive.  All dairy commodity and components prices were positive except for milk protein, which was negative only because butterfat prices were up.  Higher butter and butterfat prices do not significantly change the Class III price, they only move the value of the components that make up the Class III price from milk protein to butterfat.  (See this post for details.)  The biggest change was in the value of "Other Solids."  This followed an increase in the price of dry whey, the basis of the "Other Solids" pricing.  However, the price of "Other Solids" is still a small fraction of the prior year pricing.  In April of 2017, "Other Solids" were worth $.34/lb.  In April of 2018, they were worth $.06/lb., a drop of 82%.

Chart I - Dashboard of Producer Milk Prices and Components used to Price Milk
Cheese and butter prices were both up.  As a result they maintained the on-going price spread between them.  Since late 2015, butter has been worth significantly more than cheese. The average spread for the last three and a half years is $.67/lb.   The price spread for April 2018 was $.65/lb.  As covered in the March 4 post, higher butter prices and the spread between the cheese and butter prices no longer appears as an abnormality, but as a new "normal".

Chart II - Cheese and Butter Prices
Inventories continue to be an issue.  Chart III below shows the cheese inventory levels for the last five years.  The most current data shows another increase in the inventory of cheese.   While cheese inventory levels should grow with growth of domestic consumption and exports.  However, production of cheese has outpaced the disappearance of cheese.  Domestic consumption of cheese grows about 2% per year.  Exports have been up and down.  Production of cheese has increased by 4% in 2017 over 2016 and cheese production continues to increase at a 4% rate in 2018 compared to 2017.  Cheese exports continue to improve, but still have a way to go.  March Exports showed improvement, but they are still well below the levels of late 2014 and early 2015.  The next 5% program underway at the USDEC is extremely important to reducing the current cheese inventory levels.  More current details on exports and imports will be provided in an upcoming blog.

Chart III - Cheese Inventory
Butter inventories remain very close to the prior year in-spite of greater consumption.  Butter consumption is growing about 2.6% annually.  (See March 30 blog post.)  With no growth in inventories, there is a shortage.  The shortage in inventory is driving the high butter prices.

Chart IV - Butter Inventory
Production of butter is finally starting to show growth.  March churning showed growth not seen in years.  Is this an aberration or is it a new trend?  If it is a trend, it may help increase inventories, but it will also leave more skimmed milk to deal with and there is already a global glut of Nonfat Dry Milk/Skimmed Milk Powder (NDM/SMP).  Future posts will continue to monitor this.

Chart V - Butter Churning
Inventories of NDM/SMP are already high and could continue to grow.  Exports continue to grow (slightly), but they have still not reached the late 2017 level.  The current March ending inventories showed no change from the prior month.

Chart VI - Inventory of NDM/SMP
Prices of NDM/SMP remain low (Chart VII).  In March 66% of U.S. NDM/SMP was exported.  The competitive global price therefore dictates the domestic U.S. price.  In order to reduce stocks of NDM/SMP, prices will need to competitively low.  This means that lower prices will prevail.  If the higher level of butter churning continues, there will be more available NDM/SMP to find a home for.  Globally, the same scenario is happening.  Recently, Canada has become an active player in the international market for SMP exports.  They have been forced to sell at very low prices, which only make sense if the margins of butter churning in Canada are high enough to sustain this practice.  There will be an upcoming post on the significant expansion of milk production in Canada.

Chart VII - NDM/SMP Price
Upcoming May posts will cover the growing export market and its impact, the Canadian dairy industry, and trends in U.S. consumption of fluid milk.  All of these things play into the U.S. domestic producer milk price.