Thursday, April 27, 2017

How Much U.S. Milk is needed in the Future

The first quarter of 2017 is finished and most of the dairy data is available for the full year of 2016 and partial data is available for the first quarter of 2017.  As covered in a prior post, the volume of beverage milk is down, just not per capita, but in total.  Cheese consumption continues to grow, as has been the trend for decades.  Yogurt sales have plateaued.  Butter continues to grow in both per capita demand and in total.  The U.S. Population growth is running at less than 1 percent.  With a strong U.S.D., exports have struggled and lost ground from prior years.  If you put this all together, how much milk is really needed to meet demand?  How much might be needed in ten years?

Chart I below shows milk usage by Class for 2016.  To make a reasonably comprehensive chart of milk usage for the U.S., it requires not only the data available from the FMMO database, but also data from California expressed in FMMO terms.  And finally, some estimates of the milk usage in FMMO areas must be added to include the milk that is de-pooled.  Class I milk cannot be de-pooled, so the de-pooled amounts only exist for Class II, III, and IV.

If one makes the above adjustments, milk usage in 2016 looks like the following when expressed by milk class.

Chart I - Milk Usage by Class - 2016
To see how each Class of milk may grow or shrink, the domestic consumption of the products made from each Class was reviewed.  The table below shows the domestic growth rates for 2016 and for the last three, five and ten years for the major dairy products, the population growth, and the milk supply growth that supported these sales gains.

Table I -Historic Growth Rates

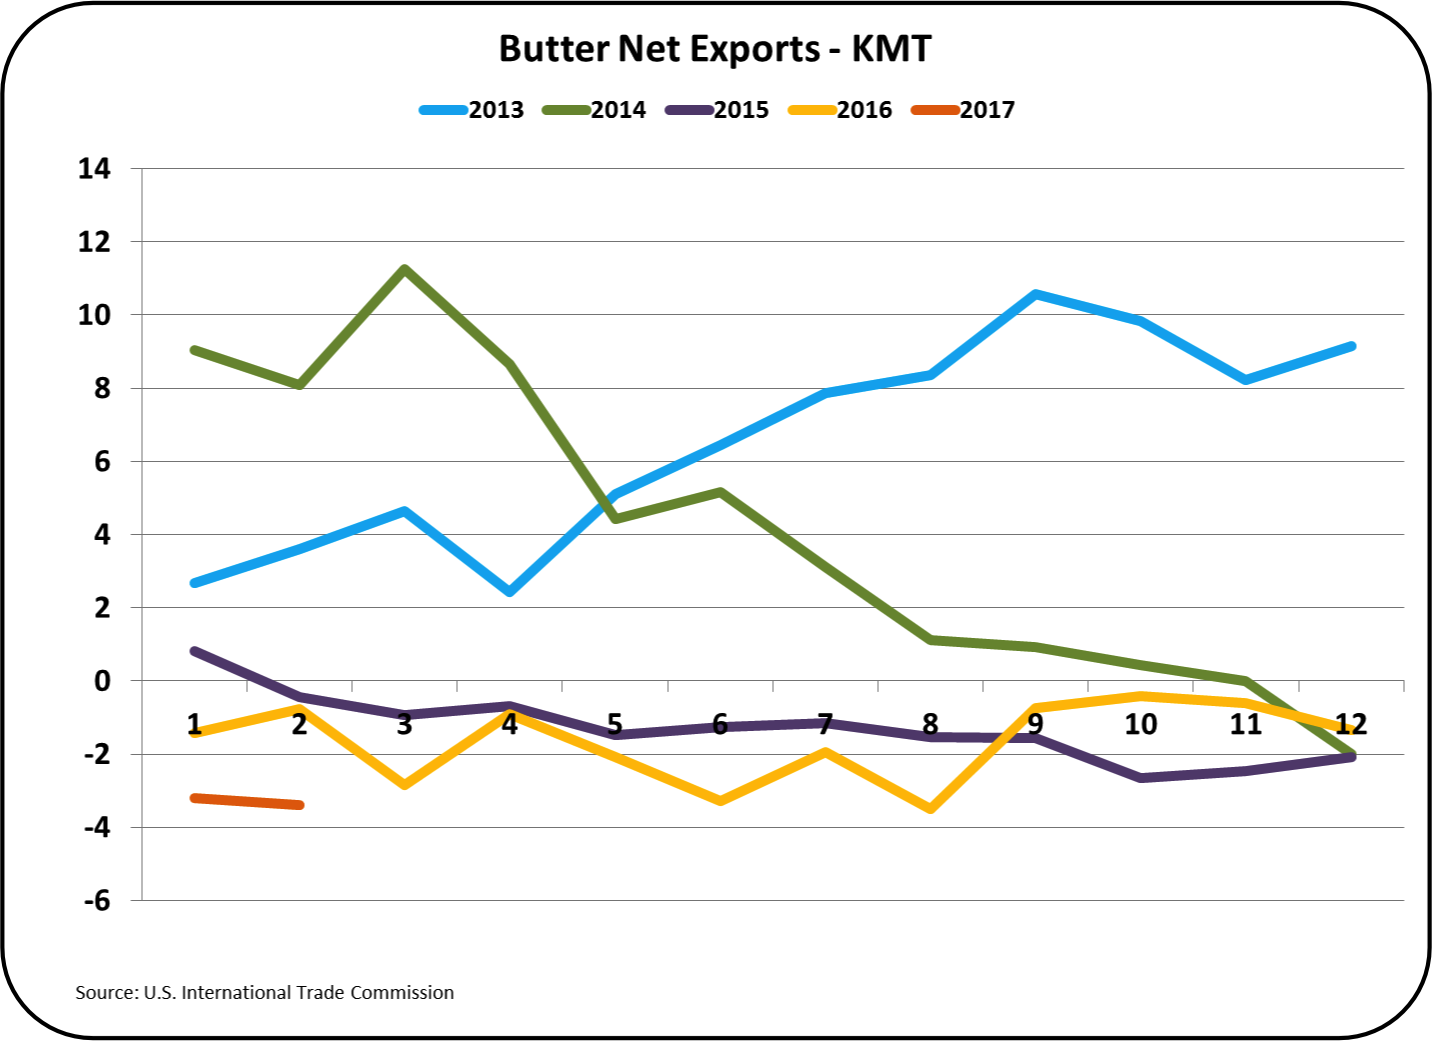
Beverage milk is falling, and therefore Class I milk will fall.  It appears that the decline in consumption of Class I milk is accelerating.  Cheese consumption has been growing and continues to grow, so Class III milk will continue to grow.  The growth rate of cheese consumption is not plateauing but accelerating.  Class III milk can be expected to increase with the increase in cheese consumption.  Butter has turned around from its half century decline and is being consumed by more people in greater amounts. The growth rate of domestic butter, like cheese, is actually accelerating.  To provide this butter, additional Class IV milk is needed.  With the butter removed and the skimmed milk dried, additional nonfat dry milk/skimmed milk powder will have to be exported.  There is always an international market for nonfat dry milk/skimmed milk powder if the price is right.

The last row in Table I shows the historic growth rate of the milk supply.  Based on the trends in sales, what is this the appropriate rate of increase for the future?

To estimate the future need for producer milk, reasonable judgements of the historic data and some assumptions on the growth of exports, were used.  Based on these, the growth rates in Table II below were chosen to estimate the future class milk usage and provide an estimate of the needed growth rate of the milk supply.

Class I milk is almost all domestic and is expected to continue it's decline by 2% per year.  Because almost no Class I milk is exported, this rate of decline will be used for the entire Class I volume.

Class II milk, the smallest of the four categories, is shown to increase only by the population increase.  The category is fairly stagnant, and the growth in yogurt has plateaued.  Exports are expected to follow this same path.

Class III milk is the largest class and after years of 2% annual growth, the last two years have shown growth of 3.5%.  Exports were growing by double digits until the last two years when exports declined.  Exports are currently about 5% of cheese production.  Exports would have to grow or shrink tremendously to influence the total and the new domestic high might not last.  Therefore, a growth rate of 3.3% was chosen.

Class IV is forecast to grow by 4% per year.  This is less than the current growth rate of butter consumption, but more than the historic growth rates.  If Class IV grows at 4% per year, there will be a lot of nonfat dry milk/skimmed milk powder to export.  However, except by importing more butter, the only solution is to make enough butter to meet domestic consumer demand.

Table II - Class Growth
Rates for Future
How will this influence the need for milk?  If these projections come true, Class I milk will decline to the point where in ten years it will require only 17% of the milk produced.  Class II milk will be static, and remain the smallest milk Class.

Class III milk will grow to almost half of the milk produced.  If the growth rate used is too aggressive, the growth to 50% will only be delayed, not capped.  Class IV shows a huge increase from 18% of the milk produced to 23% of the milk produced.  The big question is where will the remaining skimmed milk go.  Some will go to spike protein for cheese making, but a lot more will have to be exported.  At what price can this amount of skimmed milk be sold?

Table III - Projections of Milk Classes
The Classes of milk for 2017 and 2027 would look as shown in the chart below.  The 2027 chart looks very different than Chart I above for 2016.

Chart II - Milk Usage by Class - 2017
Chart III - Milk Usage by Class - 2027
And finally, what does this mean to the demand for producer milk?  In 2017, it would indicate a need for an increase of 1.7% in the milk supply.  This is roughly in line with the historic increases, but a little below some of the projections for 2017.

The really exciting part comes later as the beverage milk category shrinks in size.  By 2027, Class I would be small enough that the continued decline would have little impact on the total need for milk. The total milk supply needed is dominated by the growth of Class III and Class IV milk.  IF all these pieces came together in some fashion close to the projections in this model, the annual increase needed for the milk supply in 2027 would be 2.2%, far above historical levels.

The type of milk needed in ten years will also be very different.  Processors would primarily need milk components.  Cheese makers especially need milk protein and the increasing consumption of butter requires more butterfat.

You comments are welcome.  Future projections have no right or wrong answers.

Sunday, April 16, 2017

Exports Make Gains - Imports Still Troubling


Export and Import data for February is now available.  The charts below show significant gains in exports.  However, imports are still strong and taking a toll on the balance of exports and imports. The U.S. remains a net importer of butter.  The gains in butter exports shown in the Chart I below, are against a base of almost no exports, so while the percentage gain looks significant, there are still practically no butter exports.  Most importantly, the gain in cheese exports and the reduced cheese imports are impactful and will help keep cheese inventory levels from rising further.

Chart I
Chart II
As the data is analyzed below, one concerning development is the drop in exports of cheese and butter to Mexico.  There is continuing concern about changes to NAFTA and U.S./Mexico relations. Hopefully, these decreases are just temporary fluctuations.   Mexico is our biggest export customer.

Cheese exports grew nicely in February, but were still well below 2014/15 levels.

Chart III
While exports YTD to Mexico are down vs. the prior year, increased exports of cheese to Korea, Australia, Canada, and China more than made up the difference.  A more diversified customer base is always a good thing. 

Chart IV
Imports of cheese were down from January and from the prior two years.  This is another good sign.

Chart V
Most of the reduction in cheese imports has come from New Zealand.

Chart VI
Net cheese exports were at a five-year high in February as exports increased and imports decreased. Exports to date in 2017 have amounted to 5.2% of cheese production.  Again, this is not a record, but it is a nice improvement over the prior year.

Chart VII
Butter exports remain very low, well below the prior year, as exports to Mexico are running behind the prior year.  

Chart VIII
The price of U.S. butter remains high at $2.17/lb., which keeps exports uncompetitive in the international markets.

Chart IX
Imports of butter have decreased somewhat but are still much larger than exports of butter.  The imports from New Zealand and Mexico are down significantly but imports from Ireland are steady and new imports from Chili have kept imports of butter significant (Chart X below).  As a result, butter net exports are a negative value as the U.S. remains a net butter importer.

Chart X
Chart XI
In terms of volume, exports of NDM remain at record levels.  Chart XII below show the exports of NDM since 2000.  They have increased consistently with no end in sight.

Chart XII
Chart XII
Unfortunately the price of NDM is not attractive.  At less than $1/lb., NDM is selling at half the price levels of 2008 and 2014.  

Chart XIII
In order to provide increasing butterfat for churning, the pressure remains on finding new markets for NDM.    Mexico remains the best customer for NDM purchases, however, to keep expanding sales of NDM new markets must be developed.

Chart XIV
The U.S continues to buy significant NDM from other countries such as New Zealand, Canada, Chili, and others. Imports are about two thirds the level of exports as international prices are low and there is a lot of product for sale.

Chart XV
Exchange rates have not been reviewed in the blog for a few months as there has been no significant changes.  There are four charts below, which cover the other major dairy exporters and the U.S. dairy imports.  The USD remains strong and there has been little change in the last few months.

Chart XVI
Chart XVII
Chart XVIII
Chart XIX
February was a good month for exports.  However, the international markets are still difficult.  The USD is strong, the U. S. supply of milk continues to grow, and New Zealand, Europe, and Australia are again starting to increase the global supply of milk.  At the same time, U.S. consumers are drinking less milk.  The TPP was not good for the U.S. dairy industry and has been terminated.  Also, NAFTA is being challenged in Canada and may be changing in Mexico.  The possible change of California to an FMMO creates some more uncertainly in a geographical area with a strong history of exports and a future potential for increased exports.

The good news is the U.S. Dairy Export Council has an excellent new CEO with a proven track record.  Tom Vilsack brings new life to the organization.

Changing events will continue to be followed in this blog.

Sunday, April 9, 2017

Other Solids Make Additional Gains

March 2017 Class and Component Prices were just released.  Other Solids continued making gains with an 11.9% increase.  Butterfat prices saw very little change from the prior month, but the drop in cheese prices caused an 18.6% drop in the price of milk protein.  Milk protein is now worth $1.82/lb. and butterfat is worth $2.42/lb.  The price of Class III milk dropped 6.3% to $15.81/cwt.   While $15.81/cwt. is lower than the prior month, it is higher than eight of the months in 2016.


Other Solids, which is priced based on the price of Dry Whey, has increased every month for the last 12 months.  It is not yet at the price maintained from 2012 to 2014, but Other Solids has shown very steady growth.


Cheese pricing is the most important parameter behind Class III pricing.  Production of cheese is rising faster than the domestic consumption and exports.


As a result, cheese inventories are also growing at a rate that is above the long-term growth rate.  Higher inventories bring concerns of over supply and thusly, lower wholesale prices.  Exports, while growing, are also not growing fast enough to impact the inventories.


Cheese prices, as shown in the chart below, are at an eight-month low.  The futures market for cheese is suggesting price increases through the remainder of 2017, but even with that recovery, cheese prices will be 25% below the 2014 highs.  Cheese prices have typically shown increases, however, the current prices are well below earlier trends.  No return to 2014 levels is forecast in the next two years.


By contrast, inventories of Dry Whey are low, and with the growth in exports there are no concerns about over-supply.  To date, 37% of dry whey has been exported.  Exports have grown by 13% over the prior year.


The other route to improved pricing could come from a higher Class IV price.  Class I pricing is based on the higher of the Class III or Class IV, and the Class II price is always based on the Class IV price.


However, The Class IV price has been well below the Class III price since the start of 2016.  The Class IV price is based on the price of nonfat dry milk, and the international markets determine the price of nonfat dry milk.   The U.S. has competed aggressively in international sales of nonfat dry milk.  As a result, exports are at record levels.  However prices are very low, especially when compared to the 2014 levels.


While price improvement in nonfat dry milk is expected in the long-term, little change is expected in 2017.

CONCLUSION

Based on the above analytics and futures market progressions, producer milk prices can be expected to show only modest recovery in 2017.  Much depends on international conditions and exchange rates.  The next post to this blog will update export/imports analytics.  NAFTA is a wild card in this arena.  Mexico and Canada are the two largest importing markets for U.S. dairy products.  However, Canada is no longer accepting ultra filtration milk from the U.S., perhaps in violation of NAFTA, and export/import relations with Mexico are cloudy and may be reviewed and revised later this year.