Wednesday, November 15, 2023

Where are the Most Productive Cows?


In the last post, the long term economic impact of increasing components was reviewed.  One of the reasons components increased was by increasing milk production.  Over the last 23 years milk production per cow increased by 30%. There have been many questions on this, so this post will cover more details on the increase in milk production per cow.  In some states there have been no increases in milk production per cow and the biggest increase was 90%.

To review where the cows are, below in Table I, the 10 largest milk producing states are listed.  California and Wisconsin make up nearly 32% of the total U.S. dairy cows.  Idaho, Texas, and New York make up another 20%.  Pennsylvania, Minnesota, and Michigan make up 11% and New Mexico and Washington make up 6%.

States with the Most Cows

Table I - States with the
Most Cows in 2022

States with the Most Milk per Cow

The 10 states with the largest milk per cow are listed in Table II.  Six of the 10 largest milk per cow states listed in Table II and listed in the top ten largest dairy states in Table I and most are in the top five in dairy cows.  Missing in Table II is the largest dairy state, California.  Wyoming is a very small dairy state with a very high ranking in milk per cow.  Nebraska, New Mexico, and Nevada made the top ten in milk per cow, but are much lower in total dairy cows.

Table II - States with the Highest
Milk per Cow in 2022

Conclusion:  The largest dairy states (Table I) tend to use the most productive and financially sound methods for low cost and high revenue milk production. 

States with the Largest Increases in Milk per Cow

Table III lists the 10 states with the largest percent increase in milk per cow over 23 years.   Again, four of the 10 listed are in the 10 largest dairy states.  They are Texas, Wisconsin, New York, and Michigan.  Again, the largest dairy state, California, is not in the list.

Table III - States with the Largest
Percent Increase in Milk per Cow

How did the Four Large Dairy States Attain the Best Growth in Milk per Cow?

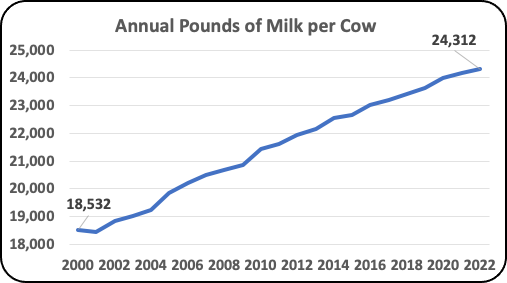
Charts I through IV below show the increases in milk per cow for the four large dairy states that have the largest and fastest growth.  They all show extremely similar and consistent growth over a long term.

Chart I - Texas Annual Milk per Cow
Chart II - Wisconsin Annual Milk per Cow
Chart III - Michigan Annual Milk per Cow
Chart IV - New York Annual Milk per Cow

Which States have the lowest growth rate in the U.S.?

Table IV lists the 11 states that have the slowest growth in milk per cow.  The list includes 11 to capture California, the largest dairy state in the U.S.   Why is California ranked near the bottom in its ability to increase milk per cow?  

Table IV - Slowest Milk per Cow
Growth States

Conclusion

Some states seem to be leading the trend to cows with higher productivity.  There are many things that can influence milk productivity.  One recent paper detailed the influence of cow comfort.  There are of course many other factors that influence milk per cow.  There is no doubt that higher milk productivity can increase revenue and cash flow.

For companies providing advice on increasing productivity, it makes sense to market to the states that seem to have the most interest in increasing productivity.

Tuesday, November 7, 2023

The Financial Impact of More Components per Cow

Cheese now utilizes over 50% of the U.S. milk produced. Cheese and other dairy items need only components, not milk volume.  Fluid milk continues to decrease in consumption.  Butterfat is at record high prices, and milk protein is at decent prices.  Are these prices just temporary?  What can a producer do to deliver milk that meets the current needs and provides adequate revenue?  This post will quantify the financial impact of changes in component pounds and prices over the last 23 years.  It appears that the increase in component prices and the increase in component levels are not a short term events.

The October 15 post showed the monthly component level changes over the last six years including the first 10 months of 2023.  Chart I below illustrates the annual butterfat percent from 2000 to 2022.  The increase in average butterfat levels is dramatic.  Today's cows are producing 10% more butterfat in their milk on the average.  That is the average, many are producing at much higher butterfat levels.

The increase in butterfat levels began in 2011 and has not stopped.

Chart I - Annual Butterfat Percent

The same is true of milk protein levels which are up 7% over this same time period as displayed in Chart II below.  Protein levels were increasing in the first 10 years of Chart II, and in 2011 began increasing at an accelerated rate.

Chart II - Annual Protein Percent 

Charts I and II are the averages for all Federal Order dairy cows. Every producer is paid for butterfat.  In seven of the Federal Orders the producers are also paid for the pounds of milk protein.  Many producers are maximizing revenue by using the proven tools to successfully increase butterfat, protein, and revenue. 

Further boosting revenue is the increase in milk per cow (Chart III).  Over the time span used in this post, milk per cow has increased by over 30%.  With that increase in milk comes higher quantities of components.

Chart III - U.S. Annual Milk Production per Cow
How has the value for these components changed over 23 years?  Chart IV displays the producer prices for butterfat and protein.  Comparing 2022 to 2000, butterfat prices have increased by 160% and protein prices have increased by 60%.
Chart IV - Average Annual Price of Butterfat and Milk Protein
If you put all these numbers together, how much does that increase revenue per cow? The impact is huge and certainly shows how producers can survive and grow.  Butterfat revenue per cow has increased from $948 USD to $3221 USD per cow annually.  That is a 240% increase per cow!  Milk protein revenue has increased from $856 to $2152 per cow, a 150% increase.

Milk protein prices did have a brief increase during the start of COVID.  It now appears to be declining and butterfat is inclining.
Chart V - Revenue per Cow for
Butterfat and Milk Protein
 
Those paid on the Component system (the majority of producers) received the combined revenue for butterfat and milk protein making the revenue increase grow from $1804 to $5374 per cow, a 200% increase (Chart VI).
Chart VI - Combined Revenue per Cow for
Butterfat and Milk Protein 
The October 15 post  discussed the 2023 additional increases in component levels.  Milk per cow will also likely show increases in milk per cow in 2023.  Increasing pounds of components in milk is vital to producer survivability and financial success.  Many techniques like breeding, cross breeding, adding fats to diets, amino acid balancing, and other techniques can increase components.  Amino acid balancing brings higher levels of both butterfat and milk protein and increases milk volume.  As an additional benefit, it also improves animal health.