Sunday, June 25, 2023

Butterfat Continues to Amaze!

One of the brightest spots in dairy production is the increase in butterfat.  The products like cheese and butter consume most of the U.S. milk.  With increased butterfat levels, less milk is needed.  Milk production is currently growing at about .5% annually (Chart I).  Butterfat production is growing by about 1.5% annually (Chart II).  Together, the increases in butterfat availability are growing at about 2% annually.  This should provide enough butterfat to satisfy the needs for cheese, butter, and other dairy products (Chart III) without any additional cows.

In round numbers, 60% of butterfat goes to cheese, 20% to butter, and 20% to all other including fluid milk.  Butterfat is essential to most all dairy products.  Products like nonfat milk and 1% fat milk are declining rapidity (see this recent post).

Chart I - Percent Increase in U.S. Milk Production 

One of the most amazing things is that the growth in butterfat levels, as measured by 12-month moving averages have never been negative in the course of this analysis.  The annual growth rate as shown in Chart II ranges from an increase of just .5% to a high of 2.1%.  Currently, as of April 2023, the percent growth rate of butterfat is 1.5%.  Butterfat production measured in millions of pounds is growing consistently year-by-year (Chart III).  In 2017, Federal Order butterfat levels were at 3.8% and currently, they are at 4.1%.

Chart II - Percent Increase in Butterfat
by 12-Month Moving Averages
Chart III is a chart of the total U.S. butterfat available from producers.  It is an estimate based on the percentage of butterfat in the Federal Orders, and the USDA estimate of the total U.S. milk production.  It shows a long and consistent pattern of growth.  The only time there was a slight falter was in 2020 with the start of COVID policies.
Chart III - Estimated Butterfat Available from Producers

Table I below ranks the percent butterfat by Federal Order for April 2023.  Federal Orders make up about 60% of total U.S. milk utilization.  The overall increase in butterfat levels changed from 4.01% in 2022 to 4.07% in 2023.  The Northwest again has the highest butterfat levels at 4.26% with a growth of .25%.  All the Federal Orders showed increased butterfat levels in April with one slight exception, the Southwest Federal Order.

The four Federal Orders paid by the "Advanced System" have the lowest butterfat levels.  They are all paid for butterfat but the interest in increasing butterfat is apparently minimal, even with high butterfat prices.

Table I - Butterfat Percent in April 2023 
Compared to April 2022 by Federal Order

The price of butterfat is a great incentive.  As shown in Chart IV below, the price has doubled over the course of the last 23+ years.  There was a significant drop in price during the COVID "stay at home" disruption, but otherwise, the growth in price has been steady.

Chart IV - AMS Price of Butterfat
Unfortunately the percent of protein in milk has not grown as fast as butterfat (Chart V).  Recently, the percent of protein in milk has shown no growth.  Protein is important primarily to cheese makers.  Yes, cheese is a big category, but it is only about half the size of the total dairy market. 

The current May price for milk protein is $1.80 per pound.  By comparison, the current May price for butterfat is $2.76 per pound.
Chart V - Growth of Milk Protein Levels in Milk

Milk protein has increased in price over 23+ years, but the increase is about 20% while the price of butterfat has doubled (Chart VI).  Part of the reason is that the AMS formula for milk protein decreases the price of protein when the butterfat price increases.
Chart VI - AMS Price per pound fir Milk Protein
Somatic Cell Counts reached 190,000 cells per milliliter in 2018.  Since then, the SCC once reached 184,000, but has returned to 190,000 (Chart VII).   Is this the best that can be done?
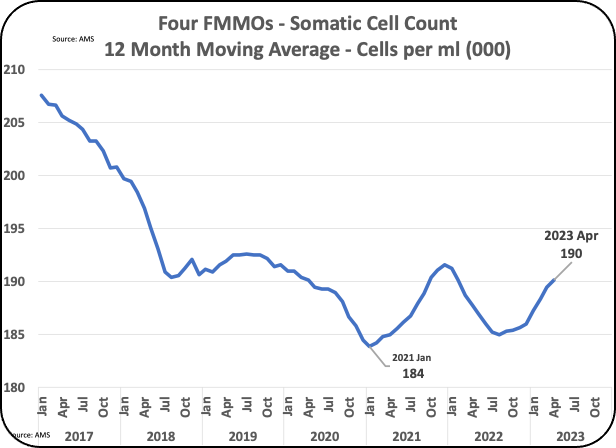
Chart VII - Long-term USA Somatic Cell counts 
With butterfat prices high, every producer should use all available means to increase the quantity of butterfat.  As shown in Table I above, there are very different levels of butterfat among the Federal Orders.  Herd-by-herd data would show even more variability in butterfat levels.  Why are not all producers and their nutritionists concentrating on maximizing butterfat levels?  It provides an amazing opportunity for revenue and cash flow.


Sunday, June 18, 2023

Why is Domestic Dairy Consumption Down? Retail Pricing?

The prior post confirmed that U.S. domestic consumption of dairy products is down.  Why are they down?  Is it the retail pricing?  Is inflation still increasing prices on retail dairy products? Inflation is typically measured in year-to-year changes.  But inflation is cumulative and builds continuously over time.  This post will compare current retail pricing to the 2019 retail prices of dairy products, before COVID and before major inflation started. The products reviewed will be the same as covered in the prior post, fluid milk, cheese, and butter.

For 15 months, the Food CPI indexes of inflation has stayed above the overall CPI.  The fluid milk price increases has exceeded the high Food CPI inflation. Current fluid milk prices compared to 2019 reflect price increases of 36%! 

The rate of price inflation for cheese and butter have been significantly less than the increases for fluid milk.  Cheese and butter prices compared to 2019 are up 10% and 11% respectively in May.

FLUID MILK

Fluid milk now costs 36% more than it did in 2019 (Chart II).  This is way above any wage and salary increases during this time.  But the amazing thing about fluid milk, as mentioned in the prior post, is that the pattern of domestic consumption has not changed.  If demand has stayed the same at higher prices, why should prices be lowered? However, fluid milk is a commodity and competitive prices should lower the price over time.  In 2023, fluid milk inflation has been lower and in May the price decreased compared to the prior year, marking deflation.

Further declines in fluid milk prices are likely in the near future.  As mentioned in the prior post, domestic fluid milk consumption will likely continue to decrease by 2% annually for some time.  The decreases are coming primarily from 1% fat and fat free milk.  As these become minimal, what will decrease next?

Chart I - Retail Price of a Gallon of Whole Fluid Milk
Chart II - Percent Increase in Fluid Milk Price
CHEESE

Cheddar cheese, which is used in the pricing of Federal Order producer milk, had major retail price increases in 2022, but in 2023, those prices are declining (Chart III).  Cheddar cheese prices increased by 14% in March 2023 compared to 2019 but in May prices increased by only 10% above 2019 prices (Chart IV).  The 2023 prices are still higher than the previous year, but the rate of increase is slowing and may soon become negative compared to the prior year.

The only reason for the decreased consumption covered in the prior post is the mid 2022 high prices combined with the overall inflation in grocery items and the fears of high interest rates and a coming depression. Producer milk is currently low priced, and this pricing should follow through to wholesale and retail Cheddar prices and hopefully will bring back growth in cheese consumption.

Chart III - Retail Price of Cheddar Cheese by Month
Chart II- Cheddar Cheese Price Increases Compared to 2019
BUTTER

Butter prices fell in 2020 and 2021 (Chart III).  However, 2022 saw huge retail price inflation and in January 2023 prices were up 33% over 2019 prices.  Prices since then have fallen and are now only 11% over 2019 prices (Chart IV).  The 2022 high prices might have discouraged some from buying butter.  It may take lower prices to get consumers back.  Margarine is significantly lower priced than butter and is an alternative when butter prices are high.  See this post for details on margarine vs. butter. When a consumer makes a purchasing change, it can take time and favorable prices to win them back.

The price drop beginning in 2023 may take some time to bring consumers back. 
Chart III - Retail Price of Butter by Month
Chart VI - Retail Price Increase of Butter
Compared to 2019 Prices
ICE CREAM AND YOGURT

The prior post covered domestic consumption of the three major dairy products, fluid milk, cheese, and butter.  Ice Cream and Yogurt are the two smaller dairy products that are not byproducts.  Both are much smaller volumes than the three covered in the prior post.  Ice cream has dropped by 25% in per capita consumption over 23 years.  During that time, volume has been made up by population increases.

Yogurt had a real growth spurt between 2000 through 2013.  Per capita consumption then began dropping.  In 2020 with the "stay at home" policies in place, yogurt has returned to a growth dairy product.  Unfortunately, it is not a big enough item to tip the scales on milk production.


Sunday, June 11, 2023

Domestic Consumption of Dairy is Down!

In the prior post the decrease in milk production was covered.  Is there enough milk to cover current demand?  At the end of that post a review of domestic consumption was promised.  Here it is!  Yes, domestic consumption of dairy is down.  This post will cover domestic consumption of fluid milk, cheese, and butter, the big three.  Domestic consumption is down in 2022 for all three.

FLUID MILK

Fluid milk has been in a decline for some time (Chart I).  During the COVID lockdown, sales first surged and then fell.  By March of 2023, the rate of decline was at 2.1% year-over-year, the same rate of decline as in March of 2018.  Prices of fluid milk did increase with inflation, but fluid milk sales have proved to be a product that is not price sensitive and is a must buy even at higher prices.  The price increases of fluid milk were covered in this prior post.

Chart I - U.S. Milk Sales
Table I shows where the major drops in fluid milk sales are.  One percent fat milk has declined by 28% over five years. Fat free milk has declined by 45%.  See this prior post for more specifics.  There will come a time when fat free milk is not available in all stores as the sales are minimal.
Table I - Change in Fluid Milk Sales by Butterfat Content
The conclusion for fluid milk is that it is continuing its decline with a consistent downward trend of about 2% annually.  This is a continuation of a long-term trend.  Within that trend, over five years conventional milk lost 11% while organic milk grew by 10%.  Organic milk sales by weight are 7% of total milk.  By sales price, organic milk makes up a bigger percent as they are priced higher than conventional milk.

CHEESE    

Cheese is the largest use of U.S. milk and has a long-term trend of growth.  Charts II and III below show the annual change in pounds consumed, and the percent of changes from one year to another.  Domestic cheese consumption grew consistently from the year 2000 to 2019, a twenty-year run.  In 2020 and 2021 with COVID stay at home policies in place followed by significant inflation, growth leveled off.  In 2022, domestic cheese consumption fell by 2% compared to the prior year.  Cheese domestic disappearance from wholesale inventories also fell in 2022 supporting the fact than domestic cheese consumption was decreasing.

Cheese production (Chart IV) has shown steady growth, but wholesale inventories (Chart V) are stable.  How is this possible?  Cheese exports increased in 2021 and 2022.  Cheese domestic growth has stopped, but increased exports have allowed production to continue to increase.

Many European countries have domestic per capita cheese consumption much higher than the U.S., so domestic growth is still possible as inflation subsides.

Chart II - Cheese Consumption
Chart III - Percent Change in Consumption of Cheese
Chart IV - Cheese Production

Chart V - Wholesale Cheese Inventory 

BUTTER

Butter consumption was down in 2022 (Charts VI and VII) as reported by Statista.  The 2022 decline in domestic butter consumption was near to 7%.  The decrease in consumption is consistent with the USDA data for disappearance from wholesale inventories in 2022 which were also down.

Production of butter was down in 2022 (Chart VIII) to sync with domestic consumption.  Exports of butter did make up for some of the lose in domestic consumption, but butter exports are minimal.

Chart VI - U.S. Butter Consumption
Chart VII - Percent Change in Consumption of Cheese
Chart VIII - Butter Production
Chart IX - Butter Wholesale Inventory

WHAT DOES IT ALL MEAN?

The decline in domestic consumption of fluid milk, cheese, and butter portrays a negative trend for U.S. dairy.  Will inflation come down and will domestic consumption pick up?  Can export markets increase to keep the U.S. dairy industry growing?  There is a lot of uncertainty in future projections.  As new data becomes available, it will be analyzed here. 

To answer the question in the previous post to this blog, the lower U.S. milk production is probably adequate for now with falling domestic consumption.