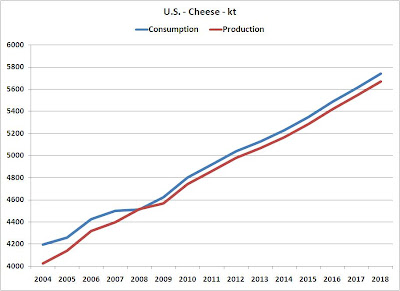
In the previous post, global movement of cheese was analyzed. New Zealand was shown to dominate the global market in cheese exports. The quantity currently produced and predicted to be produced are significant and will keep the world market supplied with relatively inexpensive cheese.
This post examines the same data for butter. All of this data, like the last post comes from the recently released report by the Organization for Economic Co-operation and Development (
OECD) and the Food and Agriculture Organization of the United Nations (
FAO). In the charts below, the major butter markets of the EU, the U.S., Australia and New Zealand are analyzed. On each chart the range of the scale is exactly the same (1000 kt) to help maintain a relative perspective.
Butter consumption and production in the U.S. are expected to be very close with no significant imports or exports. In 2008, with favorable currency rates, the U.S. became a butter exporter, however, in 2009 and thereafter, production and consumption are expected to be equal.

The European Union (EU), has been a net exporter, but by 2011, production will be reduced to only meet consumption.

Australia has been and will continue to be a net butter exporter. The amount of butter available for export is expected to be constant from 2004 to 2018.

New Zealand, who is the largest butter exporter today, is expected to increase exports
significantly over the next ten years.

In fact, New Zealand will export all of the butter previously exported by the EU as well as pick up 100% of the global growth in butter imports of other countries.

Once again, the power of the New Zealand dairy industry can be seen. Cheese was analyzed in the
July 12 post and the New Zealand dairy industry was analyzed in the
May 7 post.
The health of the U.S. dairy industry is very dependent on the global dairy market. The New Zealand model of production and export deserves significant study as it's success will have major consequences on the US. Dairy markets.
 Cheese and butter National Agricultural Statistical Service (NASS) prices declined only one penny, and dry whey prices increased slightly to offset the slight cheese and butter declines.


