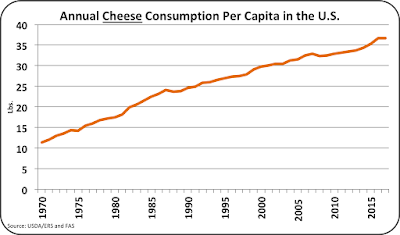
Domestic cheese consumption has a very long history of growth (Chart I below). The growth in cheese consumption has occurred through both increased capita consumption of cheese and population growth. In 2017 compared to 1970, cheese per capita consumption has tripled and the population has increase by more than 50%
The "straight line" appearance in Chart I indicates a steady gain in the quantity of growth. In other words, the annual gains are a steady amount, not a steady percentage increase. Consumption has increased a little more than 200 million pounds every year.
 |
| Chart I - Domestic Consumption of Cheese |
Chart II shows the growth in per capita consumption. Over the last 47 years, Americans have increased their consumption of cheese by almost one pound per year. Prior analysis has shown that consumption of cheese is somewhat influenced by price elasticity, meaning that if cheese is more expensive, less will be consumed. The year 2017 was an exception. In spite of slightly lower retail prices for cheese in 2017, per capita growth was flat with the prior year. This may be a warming of slower growth in per capita consumption of cheese.
 |
| Chart II - Domestic per Capita Consumption of Cheese |
Over time, the percentage growth of cheese consumption in the U.S. has slowed. As shown in Chart III below, the growth of cheese consumption has slowed over the last half century. The growth has slowed from the 6% to 8% range to the current 2% level. Two percent growth in cheese consumption will not sustain a 2% growth in the milk supply. While cheese is now the largest use for milk, the declines in consumption of fluid milk for drinking reduce the overall demand for milk. Consumption of fluid milk will be reviewed in detail in a future blog, but the decline has been going on for years and will no doubt continue.
 |
| Chart III - Percentage Growth of Cheese Consumption by Year |
Butter consumption is up (Chart IV). It has been on a growth curve for around ten years. Since 1980, domestic butter consumption has doubled. This growth has changed the profile of milk usage and complicated the overall utilization of milk. Butter utilizes only a minor portion of whole milk. Of the roughly 12.2% overall solids in milk, butterfat accounts for about 3.5% of those solids. That leaves about 8.6% of the solids in the form on skimmed milk. Sales of fluid skimmed milk have dropped precipitously in the last five years. That leaves the only available use for skimmed milk as Nonfat Dry Milk/Skimmed Milk Powder. There is already too much in inventory. This a serious problem in the U.S. and the international markets.
 |
| Chart IV - Domestic Consumption of Butter |
By the available data, the annual per capita consumption of butter (Chart V) flattened in 2017. Retail butter prices are high compared to alternative vegetable based spreads and the price elasticity may have dampened sales.
 |
| Chart V - Domestic per Capita Consumption of Butter |
Chart VI shows the growth in domestic butter consumption since 1970. That growth is leveling off and is currently at about 2.6% per year. That level of domestic growth will still pressure domestic supplies and keep prices high. Currently little butter is exported and with these tight supplies, that will probably not change.
 |
| Chart VI - Percentage Growth of Butter Consumption by Year |
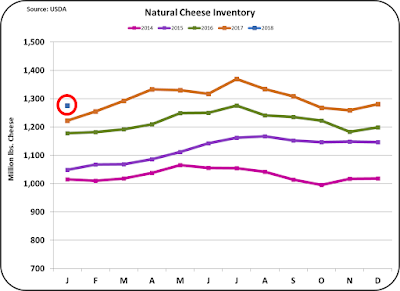
These analytics indicate a continuing story of the current dairy situation. Domestic consumption of cheese will not cure the current high level of cheese inventories. This must come from increased exports. Domestic butter consumption will continue to put pressure on inventories and, as result, little butter will be exported.
This confirms that the low current producer prices can only be improved by lower milk production or increased exports. The continued growth of butter consumption will keep pressure on what to do with the remaining skimmed milk. Low prices for Nonfat Dry Milk/Skimmed Milk Powder can be expected to continue.


