 |
| Chart I - Dairy Commodities and Component Prices |
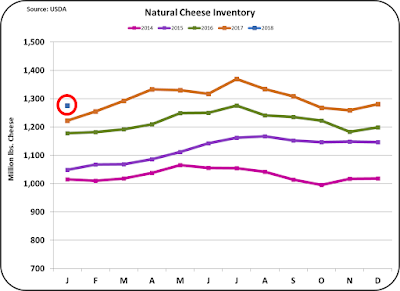
Because cheese prices are so closely linked to Class III milk price, the cheese inventory must be reduced before producer milk prices can improve.
 |
| Chart II - Cheese Inventory |
One element preventing big increases in butter production is the issue of what to do with the skimmed milk that is left when the butterfat is removed. Increases in butter production could throw more skimmed milk on the market, which if dried would make the very high nonfat dry milk inventories (Chart IV) even higher.
 |
| Chart III - Butter Inventory |
 |
| Chart IV - NDM/SMP Inventory |
Dry whey inventory is also high, but down considerably from the Q4 2017 levels. As mentioned in the February 5 post to this blog, because this inventory can be reduced quickly by drying less whey, inventory can recover quickly. Dry whey is primarily an export items and is subject to global price fluctuations.
 |
| Chart V - Dry Whey Inventory |
While the WMP category is about 1/10th the size of NDM/SMP, it does provide an opportunity to store excess milk because WMP properly packaged does have a relatively long shelf life. The increased WMP inventory is nearly 50% larger than the prior year.
 |
| Chart VI - WMP Inventory |
VOLATILITY
Producer dairy prices are subject to extreme price volatility and it is very difficult to manage a business with extreme volatility (Chart VI). The price changes result primarily from inventory fluctuations of the commodities used to price milk components. Some of these fluctuations come from changing consumer consumption in the U.S. and producer over-production. However, most of the inventory fluctuation can be traced to variations in exports and imports as dairy commodities are increasingly traded globally. Current examples of events that could increase milk-pricing volatility are changes in NAFTA, possible changes in tariffs countering U.S. tariff changes, and changing weather that could impact production in dairy exporting countries. As dairy commodities are increasingly traded internationally, milk pricing will increase in volatility.
 |
| Chart VI - Long-Term Trends in Component Price |
Table I below provides another view of this volatility. By far, the volatility is greatest in the price of other solids. Over the last five years, the price of other solids have varied from $.03/lb. to $.50/lb. The price of other solids is calculated based on the price of dry whey. Dry whey is heavily exported and that makes the pricing dependent on international events and prices. Fortunately, the price volatility of other solids has a small impact on the Class III price.
Butterfat has varied from $1.32/lb. to $3.25/lb. While the price has been very volatile, the volatility has been lower than either of the other two components, which make up the Class III price. The price of butterfat is based on the price of butter. Most of the increase in price has come from the increased per capita consumption, both domestically and internationally. Meeting this demand has led to an excess of skimmed milk which in-turn is feeding inventories of NDM/SMP. Fortunately, the price volatility of butter has a small impact on the Class III price.
 |
| Table I - Price Volatility of Milk Components |
 |
| Chart VII - Correlation Between the NASS Cheese Price and the Class III Milk Price |
As analyzed in a prior post, the best producer strategy is to always manage for maximum component levels with a consistent strategy. Strategies that chase the uncertain market with changing management strategies is a hopeless and frustrating effort.


No comments:
Post a Comment